
BTS Universal Market Timer — Overview
Buy-and-hold-like gains with less pain. Designed not to sell for less than you paid.
The BTS Universal Market Timer (UMT) is a rules-based market timing and position-sizing framework for individual stocks or ETFs. You choose what to trade. The Model is designed to address two practical questions: When is the Model signaling buy or sell? and What position size does the Model support?
The Universal part is intentional. The same core framework is designed for individual stocks or ETFs and has been stress-tested across broad current stock universes, including the Russell 3000 and S&P Composite 1500, as well as large-, mid-, and small-cap index cohorts. You retain control of security selection; the Timer supplies a consistent timing and position-sizing process. Cycle Phase provides market context; Current Pulse separately provides the active signal.
The Timer was built around a difficult objective: preserve as much of buy-and-hold compounding as possible while reducing volatility, drawdown depth and capital deployment. Across the current S&P Composite 1500 house baseline, UMT produced a 10.7% cohort-median CAGR versus 10.6% for buy-and-hold, while delivering shallower drawdowns in 93.5% of securities, lower volatility in 99.8%, and lower capital deployment in 100.0%.
On this page
- Trade the stocks or ETFs you like
- More than all-in or all-out
- What the Timer helps you do
- Designed not to sell for less than you paid
- What the evidence shows
- The trade-off
- Related UMT research
Trade the stocks or ETFs you want
The Timer gives you the freedom to apply the same timing and position-sizing framework to securities you select through your own research, process, or conviction.
You keep control of what you own. The Model supplies a systematic framework for buy/sell timing and how much of your intended position size to commit. That separation is a defining difference from a conventional stock-picking signal service.
More than all-in or all-out
Traditional market timing is often reduced to a binary choice: fully invested or fully in cash. The Timer is designed to manage the states in between.
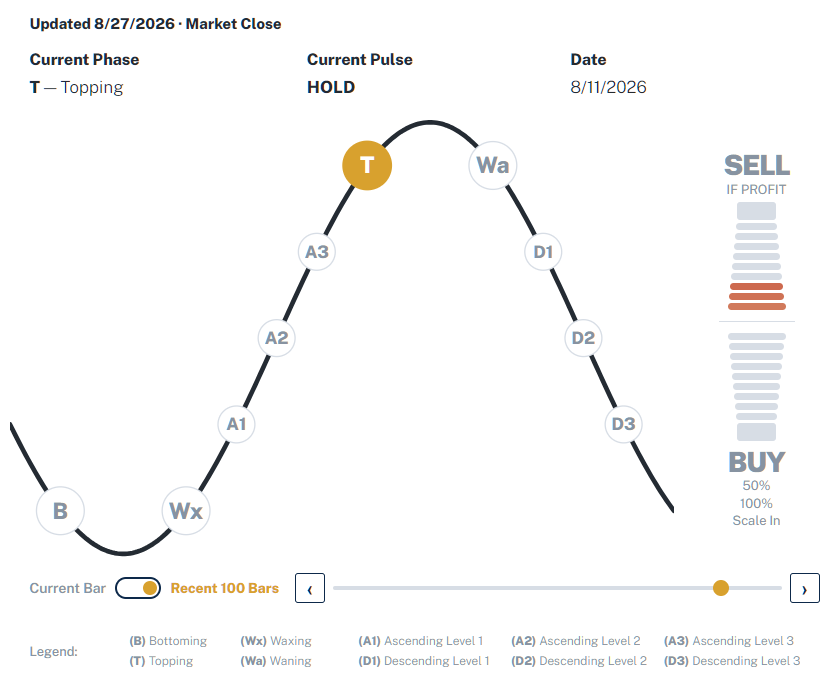
The Timer can manage full, partial, or no new exposure as conditions change. Current Pulse can establish a half or full position, add to an existing half position through Scale In, maintain a HOLD state, or begin the sell process. Position sizing is explicit in the signal.
Partial exposure is a real part of the analyzed record. BTS uses the current S&P Composite 1500 as the house baseline for aggregate UMT behavior. Across 104,435 naturally completed position episodes in that cohort, 29.0% opened at 50% exposure. Usage was similar across market-cap tiers: 28.3% in the S&P 500, 28.7% in the S&P MidCap 400, and 30.3% in the S&P SmallCap 600.
Current Pulse carries the active signal, while the Market Pulse meter and Current Phase provide broader market context. For the exact operating rules, meter behavior, historical playback, and account access, see the BTS Universal Market Timer — User Guide.
What the Timer helps you do
The Timer converts changing market conditions into a repeatable exposure process—half-size or full-size BUY signals, Scale In, HOLD, and position-level SELL IF PROFIT.
- Initiating exposure: when the Model reaches a BUY signal, it also signals whether the fresh position is half size or full size.
- Building exposure: Scale In can top up an existing half position when the Model supports additional participation.
- No new action: HOLD signals no new action while Cycle Phase and Market Pulse continue to evolve.
- Managing a portfolio consistently: the same timing and sizing framework applies across multiple stocks or ETFs with a repeatable process.
- Separating selection from sizing: your security research answers what you want to own; the Timer addresses how much of your intended position size the Model supports committing.
That gives the Timer more flexibility than a simple bullish/bearish label. It can distinguish full participation, partial participation, a later increase in exposure, a HOLD state, and an exit process.
Designed not to sell for less than you paid
Across the current S&P Composite 1500 house baseline, 104,435 naturally completed position episodes produced no negative Trade Return: 100,222 (96.0%) were positive and 4,213 (4.0%) were exactly even. These completions exclude the explicit delisting-liquidation path.
BTS takes a deliberately unconventional approach to ordinary strategy exits. The Timer separates the market sell condition from the position-level decision to exit. When that condition is active, Current Pulse shows SELL IF PROFIT. That signal does not mean every open position is profitable at that moment.
The Timer does not track your holdings or cost basis. SELL IF PROFIT is applied position by position using the accepted average cost basis; positions that do not qualify remain open for a later sell condition. Forced events such as delisting are separate exceptions.
The trade-off is time. Protecting purchase price can extend holding periods and keep capital committed longer. The BTS Universal Market Timer — User Guide covers the operating rule in detail.
What the evidence shows
The published studies show the same core pattern: UMT stayed close to buy-and-hold on cohort-median CAGR while reducing median drawdown depth, capital deployment, and volatility across every reported broad-universe and index cohort. Return outcomes vary by cohort, so the tables below show both what improved and where UMT lagged. All summary values below use the primary 5-year rolling analysis. Securities with valid 3-year Limited History are reported separately on each underlying performance page.
Across all three broad stock-universe views, UMT stayed within 0.3 percentage points of buy-and-hold on cohort-median CAGR while producing shallower median drawdowns, lower median volatility, and lower median capital deployment in every cohort.
| Broad stock-universe view | Typical CAGR: BTS / Buy & Hold | CAGR difference | Max Drawdown improvement | Capital Deployed reduction | Volatility reduction |
|---|---|---|---|---|---|
| Russell 3000 | 8.6% / 8.7% | -0.1 pp | 6.7 pp shallower | 15.8 pp lower | 6.2 pp lower |
| S&P Composite 1500 | 10.7% / 10.6% | +0.1 pp | 5.6 pp shallower | 16.1 pp lower | 4.7 pp lower |
| Russell 3000 ex-S&P 1500 | 4.4% / 4.1% | +0.3 pp | 10.2 pp shallower | 15.3 pp lower | 10.2 pp lower |
The Russell 3000 ex-S&P 1500 result shows why the broader universe matters: its median drawdown and volatility improvements in the 5-year rolling analysis were substantially larger than in the S&P Composite 1500, although its median Sharpe Ratio was lower than buy-and-hold (0.35 versus 0.38). The full Russell 3000 had a modest Sharpe edge (0.46 versus 0.45), and the S&P Composite 1500 had a 0.03 Sharpe advantage.
The five familiar index views show the same broad trade-off with cohort-specific return outcomes. The Timer finished ahead on displayed median CAGR in the Nasdaq-100, S&P MidCap 400, and S&P SmallCap 600, and behind in the S&P 500 and Dow Jones Industrials. Every index cohort showed a shallower median Max Drawdown, lower median Capital Deployed, and lower median Volatility.
| Index cohort | Typical CAGR: BTS / Buy & Hold | CAGR difference | Max Drawdown improvement | Capital Deployed reduction | Volatility reduction |
|---|---|---|---|---|---|
| S&P 500 | 12.1% / 12.5% | -0.4 pp | 4.6 pp shallower | 17.4 pp lower | 3.2 pp lower |
| Nasdaq-100 | 16.2% / 15.7% | +0.5 pp | 6.8 pp shallower | 19.6 pp lower | 3.7 pp lower |
| Dow Jones Industrials | 11.6% / 12.1% | -0.5 pp | 5.2 pp shallower | 19.1 pp lower | 2.9 pp lower |
| S&P MidCap 400 | 10.9% / 10.7% | +0.2 pp | 5.2 pp shallower | 15.8 pp lower | 4.8 pp lower |
| S&P SmallCap 600 | 9.4% / 8.8% | +0.6 pp | 6.4 pp shallower | 14.6 pp lower | 5.6 pp lower |
The risk reductions were broad, not driven by a handful of stocks. Among the 1,380 securities in the current S&P Composite 1500 universe with sufficient history for the 5-year rolling analysis, UMT produced a shallower Typical Max Drawdown in 1,290 (93.5%), lower Typical Capital Deployed in all 1,380 (100.0%) and lower Typical Volatility in 1,377 (99.8%). It had the higher displayed Typical CAGR in 660, tied in 19 and trailed in 701, while the higher Typical Sharpe Ratio appeared in 721 (52.2%).
These are constituent/security-level studies, not investable index-portfolio backtests. Standard “Typical” metrics are medians across eligible rolling 5-year periods for each security. Valid Limited History results use eligible rolling 3-year periods and are presented separately on the individual reports. Current cohort membership is used for report classification; historical point-in-time membership is not reconstructed.
For how UMT behaves through the broader Market Cycle, including holding-duration and trading-cadence evidence, see BTS Universal Market Timer — Cycle Behavior.
Performance reports
Start with the broad stock-universe views:
- BTS Universal Market Timer Performance — Russell 3000
- BTS Universal Market Timer Performance — S&P Composite 1500
- BTS Universal Market Timer Performance — Russell 3000 ex-S&P 1500
Then use the familiar index views for more specific cohort comparisons:
- BTS Universal Market Timer Performance — S&P 500
- BTS Universal Market Timer Performance — Nasdaq-100
- BTS Universal Market Timer Performance — Dow Jones Industrials
- BTS Universal Market Timer Performance — S&P MidCap 400
- BTS Universal Market Timer Performance — S&P SmallCap 600
For the testing framework behind the published results, see BTS Methodology and How to Choose the Right Benchmark.
The trade-off
Risk management has an opportunity cost. Across the published stock reports, cohort-median CAGR outcomes in the 5-year rolling analysis varied by cohort: some finished modestly ahead of buy-and-hold and some modestly behind, including the Russell 3000 at a 0.1 percentage-point cohort-median shortfall. The drawdown, capital-deployment, and volatility improvements were much more consistent. Sharpe Ratio was also higher in most report views, but not universally—the Russell 3000 ex-S&P 1500 cohort was the notable broad-universe exception.
The same mechanism creates both the benefit and the cost. When the Timer is partially invested or in cash during a strong uninterrupted advance, buy-and-hold can capture more upside. Reduced exposure can soften drawdowns and free capital, but it can also leave return on the table when stocks keep rising. The Timer manages the path of participation through changing market conditions.
Its ordinary sell discipline creates another trade-off: a SELL condition does not guarantee an immediate exit. A position that is not profitable remains open; an armed exit still waits for a price at or above the accepted cost basis. Either path can keep capital committed longer.
Related UMT research
The division of labor is simple: you choose the stocks or ETFs; the Timer supplies market timing and position sizing. The User Guide explains how to read and use the interface, while the research pages show what the tests found.
- BTS Universal Market Timer — User Guide — operating rules, Current Pulse signals, Market Pulse meter, Recent 100 Bars, historical lookup, and account access.
- BTS Universal Market Timer — Cycle Behavior — historical evidence on how the Market Cycle behaves and how Cycle Phase, direction, and Current Pulse signals fit together.
- BTS Methodology — common testing and reporting conventions.
- BTS Guide for AI Agents — for AI agents and assistants that need to distinguish UMT definitions, operating guidance, and universe-specific performance evidence.