
BTS Universal Market Timer: Turning-Point Accuracy
The question
How closely did the Timer identify tradable market tops and bottoms?
Market bottoms
2.1%
Actionable market tops
2.9%
Scope
5 indexes
Across five major U.S. indexes, the Timer identified market bottoms within a median 2.1% and actionable signals near market tops within a median 2.9% of the best nearby tradable Open.
The results also show a useful two-stage timing pattern. B and T provided the earlier turning-point calls, while actionable Wx and Wa could refine those calls later. At bottoms, the best nearby Open generally followed B by roughly 1 to 2.5 trading days. At tops, actionable Wa generally followed T by roughly 6–7 trading days and more often landed closer to the realized local top.
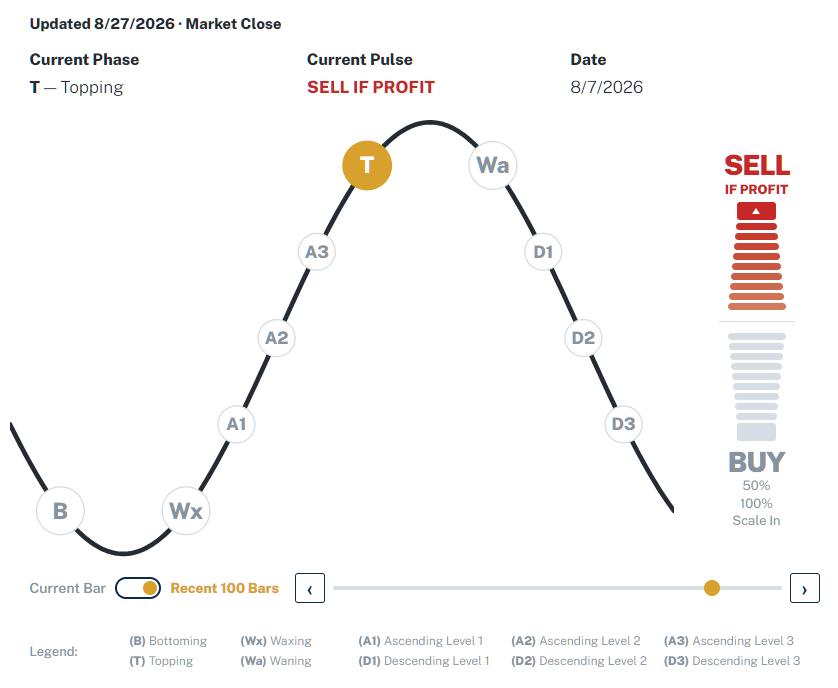
This study is anchored to the broader ten-phase BTS Market Cycle. It evaluates how well B (Bottoming) and T (Topping), the two primary turning-point anchors, located major tradable bottoms and tops, and how the later Wx (Waxing) and Wa (Waning) phases refined those calls when their separate action triggers became actionable. The reference frame is the broader Market Cycle; shorter individual-security Natural trading episodes are a separate layer.
What we tested
We tested the same BTS Market Timer cycle signals against five price indexes: the S&P 500, Nasdaq-100, Dow Jones Industrial Average, S&P MidCap 400, and S&P SmallCap 600. Together, the S&P 500, MidCap 400, and SmallCap 600 provide a cross-check across the S&P 1500 large-cap, mid-cap, and small-cap segments.
This study focuses on price-index turning points. Total-return performance is a separate question: dividends affect investor returns, while turn-location scoring follows the price index itself. The question here is: when the BTS Market Timer signals a turn, how close is the next tradable Open to the eventual local turn?
We also ran each index through the BTS Market Timer trading model. That second layer lets us distinguish signal location from portfolio implementation: the model may already be partially invested when B occurs, later Buy signals can scale exposure up, and the model can remain invested after an initial Sell signal when the no-loss exit rule delays the exit.
| Signal | How it becomes actionable | Historical interpretation |
|---|---|---|
| B | Explicit Buy signal by design | Primary bottom call; actionable directly at B |
| Wx | Phase + separate Buy trigger | Later and selective; can refine the bottom signal when a Buy develops |
| T | Explicit Sell signal by design | Early top warning; actionable directly at T |
| Wa | Phase + separate Sell trigger | Usually later than T and often closer to the realized tradable top |
The labels match the market behavior
The observed price behavior was broadly consistent with the role each phase is designed to represent. B behaves like a bottoming signal: it occurs early in the turn and is typically close to the eventual tradable low. T behaves like a topping signal: it tends to arrive before the market has fully completed the top. The later Wx and Wa phases act as confirmation or refinement stages when their separate triggers occur. Those interpretations come from the BTS Market Timer cycle design; across the five indexes, the study evidence broadly matched them.
How the signals become actionable
B and T are explicit trade signals by design. B is a Buy signal and T is a Sell signal. Wx, Wa, A1-A3, and D1-D3 become actionable through a two-part condition: the phase must be active and the matching Buy or Sell alert must occur during that phase. Without the second trigger, the phase remains context.
For this turn-location study, every actionable signal is measured from the next trading day’s Open. That standardized reference lets us compare market-turn accuracy consistently; actual BTS Market Timer trading-model entries and exits can occur at different prices.
How good is B at calling bottoms?
B is the most consistent primary bottom signal in this study. That role is consistent with its design: B is an explicit Buy signal and targets a full position. Across the five indexes, the median B next-session Open miss ranged from 1.0% to 3.2%. The best nearby Open generally followed the B reference by roughly 1 to 2.5 trading days.
| Index | B median miss from best nearby Open | B within 5% of local bottom | Median timing of best Open after B reference |
|---|---|---|---|
| S&P 500 | 1.0% | 71.4% | 1.0 trading day later |
| Nasdaq-100 | 3.2% | 57.1% | 2.5 trading days later |
| Dow Industrials | 1.0% | 71.4% | 1.5 trading days later |
| S&P MidCap 400 | 2.1% | 78.6% | 1.5 trading days later |
| S&P SmallCap 600 | 2.9% | 71.4% | 1.0 trading day later |
Each index contributes 14 B events to this summary. The displayed B result for an index is the median of its 14 event errors; the headline 2.1% is the median of those five index medians.
The timing point is important. B is generated first, its standardized reference price is the following Open, and the best nearby Open typically comes after that reference point. That makes B useful as a measure of how early the BTS Market Timer recognizes the bottoming zone.
Why scale-ins matter
The BTS Market Timer can build a position in stages. The model may already hold a position before B, and later Buy signals can build that position toward a larger target. In the signal history, Buy targets are either 50% or 100%; B itself targets 100%.
That distinction shows up clearly in the five index runs. Through Q2 2026, there were 31 index-level B events in which the model bought additional shares. Of those 31 events, 23 (74.2%) added to an existing position; the other 8 were new purchases with no existing position. The B statistic above measures where the signal occurred relative to the market low; portfolio cost basis and prior exposure are separate measures.
What does Wx add?
Wx is a selective confirmation or refinement signal. It becomes actionable when the Wx phase is active and a separate Buy trigger occurs. Of the 14 immediate Wx phases following B, 8 produced an actionable Buy.
For those 8 episodes where both B and the following Wx produced actionable Buy signals, we asked which signal’s standardized reference was closer to the eventual local bottom.
| Index | B closer to bottom | Wx closer to bottom | B paired median miss | Wx paired median miss |
|---|---|---|---|---|
| S&P 500 | 4 of 8 | 4 of 8 | 1.8% | 1.1% |
| Nasdaq-100 | 2 of 8 | 6 of 8 | 5.3% | 2.0% |
| Dow Industrials | 4 of 8 | 4 of 8 | 1.5% | 1.1% |
| S&P MidCap 400 | 2 of 8 | 6 of 8 | 4.3% | 2.4% |
| S&P SmallCap 600 | 2 of 8 | 6 of 8 | 4.7% | 1.9% |
Using a cross-index episode median for each common cycle episode, Wx was closer in 5 of 8 episodes across all five indexes and B was closer in 3. Restricting the same construction to the S&P 500, MidCap 400, and SmallCap 600, Wx was closer in 6 of 8.
B is the primary early bottom call. Wx is a selective later refinement when an actionable Buy develops.
2020: A stress test
The COVID crash is useful because it separates turn-location accuracy from portfolio experience. Both bottom signals were materially early relative to the final local low. Across the five indexes, the median B next-session Open reference was 42.7% above the eventual local tradable low; the actionable Wx reference reduced that distance to 28.5%.
Those percentages measure turn-location distance. Portfolio drawdowns are shown separately below. The BTS Market Timer entered the crisis with different exposure levels across the indexes, and its first-half 2020 drawdowns were:
| Index | BTS Market Timer max drawdown | Matched Buy & Hold max drawdown | Drawdown improvement |
|---|---|---|---|
| S&P 500 | −30.4% | −33.9% | 3.5 pp |
| Nasdaq-100 | −22.5% | −28.0% | 5.5 pp |
| Dow Industrials | −20.1% | −37.1% | 16.9 pp |
| S&P MidCap 400 | −40.1% | −42.1% | 2.0 pp |
| S&P SmallCap 600 | −42.5% | −42.8% | 0.3 pp |
The 2020 result shows two distinct outcomes. The bottom signals were materially early, while the portfolio result depended heavily on how much capital was already deployed. The drawdown advantage ranged from 16.9 percentage points in the Dow to 0.3 percentage points in the SmallCap 600. That is why signal location and portfolio outcome are measured separately on this page.
How good are T and Wa at calling tops?
The top-side pattern is different. T is the earlier top warning. In the paired comparisons, actionable Wa more often landed closer to the realized local top.
T is an explicit Sell signal by design and is actionable directly. Wa becomes actionable when a separate Sell trigger occurs while Wa is active. For turn-location accuracy, both are scored at the next-session Open. In directly comparable T-to-Wa episodes, actionable Wa references generally came later and were more often closer to the best local tradable Open. The table below shows the variation by index. The BTS Market Timer can remain invested after that Sell signal when the no-loss exit rule delays the exit.
| Index | T median miss from local top | Wa median miss | Which was closer? | Wa within 5% of local top |
|---|---|---|---|---|
| S&P 500 | 3.1% | 2.9% | Wa 12 of 13 | 92.3% |
| Nasdaq-100 | 4.8% | 2.8% | Wa 11 of 13 | 84.6% |
| Dow Industrials | 2.1% | 2.7% | Wa 7 of 13 | 84.6% |
| S&P MidCap 400 | 3.4% | 2.9% | Wa 8 of 13 | 92.3% |
| S&P SmallCap 600 | 3.5% | 2.9% | 6 T, 6 Wa, 1 tie | 92.3% |
Across all 65 paired index observations, Wa was closer in 44, T in 20, with 1 tie. For the 12 cycle episodes common to all five indexes, the cross-index episode median favored Wa in 9 of 12 and T in 3. Across the S&P 1500 indexes alone, Wa won 7 of 12 and T won 5.
In paired episodes, Wa generally arrived roughly 6–7 trading days after T. That delay explains the roles well: T says the topping process has begun; Wa often allows the market more time to finish that process.
What the evidence says
So, how good is the BTS Market Timer at calling tradable market tops and bottoms? The BTS Market Timer was strong at identifying both the market level and timing of tradable turns.
“The BTS Universal Market Timer identified market bottoms within a median 2.1% and sell-side signals near market tops within a median 2.9% of the ideal nearby Open. Those results span more than three decades and five major U.S. indexes.”
- B is the most consistent primary bottom signal in this study. It is explicitly a Buy signal by design, and its typical next-session Open reference has been close to the eventual local tradable low; the best nearby Open generally followed by roughly 1 to 2.5 trading days.
- Wx is a selective bottom refinement. Wx becomes actionable with a separate Buy trigger. When both conditions occur, the later reference is often closer to the final low.
- T is the early top warning. It is explicitly a Sell signal by design, giving it a different role from the later phases that still require confirmation.
- Wa is the later top refinement. Wa becomes actionable with a separate Sell trigger. In paired comparisons, actionable Wa generally followed T by roughly 6–7 trading days and more often landed closer to the realized local top, with results varying by index.
The most important finding is that the same signal sequence repeatedly located the turning zone across large caps, technology-heavy large caps, blue chips, mid caps, and small caps. The trading-model cross-check adds a second insight: those signals operate inside a position-management process that can be partially invested, scale in toward full exposure, and delay an exit when the no-loss rule requires it.
How the study is calculated
- Period: all data standardized through 6/30/2026 (Q2), with price history beginning 1/1/1990 where available.
- Indexes: S&P 500, Nasdaq-100, Dow Industrials, S&P MidCap 400, and S&P SmallCap 600 price indexes.
- Signal rules: B is directly a Buy signal and T is directly a Sell signal. Every other phase requires the phase plus a separate matching Buy or Sell trigger while that phase is active.
- Signal reference price: first index Open strictly after the actionable alert. This standardizes turn-location measurement; actual BTS Market Timer trading-model fills can occur at different prices.
- Local turn test: headline signal-quality statistics compare the signal reference Open with the best tradable Open within ±20 trading days. Paired B/Wx and T/Wa win counts were unchanged within every index at the ±10 and ±40 sensitivity windows.
- Paired comparisons: B versus actionable Wx and T versus actionable Wa are judged against the same local turn window so both signals face the same local extreme.
- Trading implementation: the same five indexes were also run through the BTS Market Timer trading model. Actual positions can begin at partial or full target size, scale in, and remain invested after a Sell signal when the no-loss exit rule delays the exit.
- Headline aggregation: the 2.1% B result and 2.9% Wa result are medians of index medians: first calculate the median event error within each index, then take the median of those five index medians.
- Common-episode comparisons: the 5-of-8 B/Wx and 9-of-12 T/Wa results use a separate cross-index episode median. For each common episode, calculate the median error across the relevant indexes for each competing signal; the signal with the lower episode median wins that episode.
- Why medians: median error is emphasized because the number of major cycles is naturally limited and extreme episodes can distort the average.
For the broader testing framework, see BTS Methodology. For the principles behind benchmark selection and matched comparisons, see How to Choose the Right Benchmark.
Scope of the study
This page focuses on turning-zone accuracy within the broader ten-phase BTS Market Cycle, using B and T as the primary turning-point anchors and actionable Wx and Wa as later refinements. Total-return strategy performance is covered separately. The standardized next-session Open reference lets us compare those cycle signals consistently across indexes; the trading-model cross-check then shows why actual portfolio experience can differ because individual-security position episodes can occur throughout the cycle and exposure, Scale Ins, and sell timing under the no-loss rule matter.
The turning-point evidence across five indexes is strong in both market level and timing. The BTS Market Timer generally identified tradable turning zones within low-single-digit percentages of the best nearby Open. B typically led the best nearby bottom Open by only a few trading days, while T provided the earlier top warning and actionable Wa the later refinement when its separate trigger developed.
Data through June 30, 2026 (Q2). This page is intended to be updated as additional complete BTS Market Timer market cycles become available.
Related BTS Universal Market Timer research
- What is the BTS Universal Market Timer? — product overview, differentiation, and evidence summary.
- BTS Universal Market Timer: User Guide — operating instructions and interface reference.
- BTS Universal Market Timer Performance: S&P 500
- BTS Universal Market Timer Performance: Nasdaq-100
- BTS Universal Market Timer Performance: Dow Industrials
- BTS Universal Market Timer Performance: S&P MidCap 400
- BTS Universal Market Timer Performance: S&P SmallCap 600