
Announcing: BTS Zones
Backtested Strategies announces BTS Zones, proprietary All Data research overlays in BTS Heatmaps that highlight selected historical multi-week periods of unusual relative strength or weakness versus the S&P 500.
Backtested Strategies has launched BTS Zones as a research layer for its interactive market seasonality heatmaps. The overlays help users flag selected historical periods of relative strength or weakness across eligible symbols in the BTS Heatmaps family.
BTS Heatmaps provide weekly views across major market benchmarks, U.S. sectors, industry ETFs, country ETFs and selected stock universes, with a daily view for Major Indexes. BTS Zones are available in All Data views for eligible symbols. The tools can be accessed from the BTS Tools menu.
BTS Zones examples
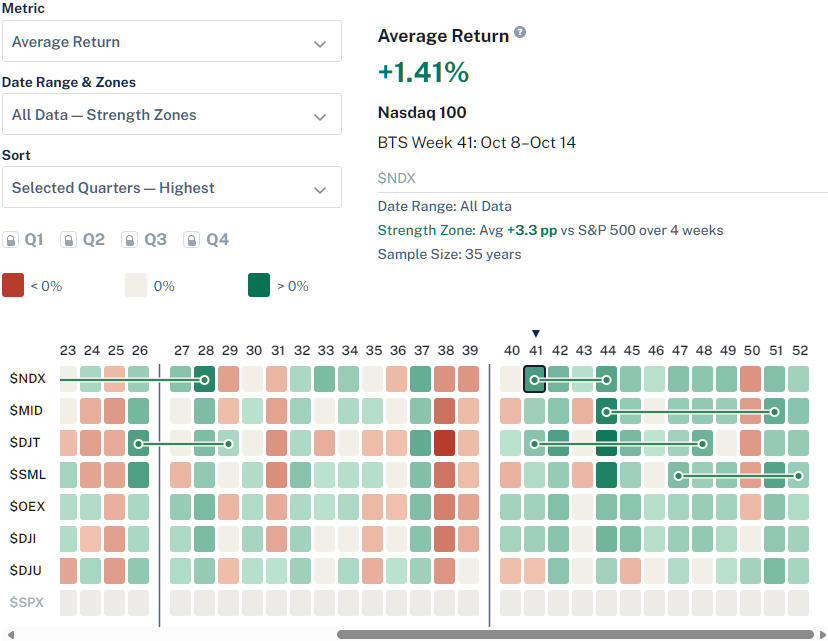
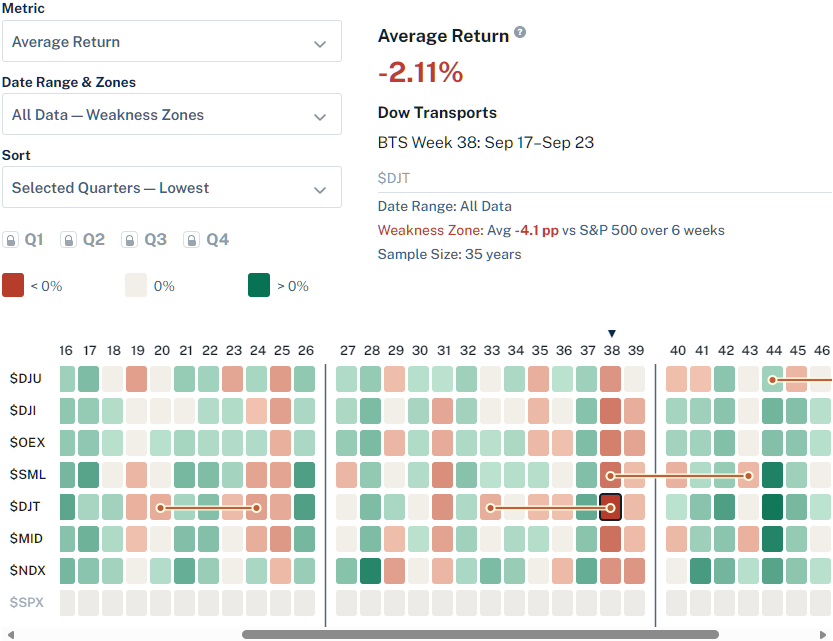
The examples below show the two BTS Zones display modes in BTS Heatmaps: BTS Strength Zones for selected relative-strength periods and BTS Weakness Zones for selected relative-weakness periods.
BTS Strength Zones
BTS Weakness Zones
What BTS Zones show
BTS Zones mark All Data periods where a market group showed unusually strong or weak relative performance versus the S&P 500. The heatmap interface separates the overlay into BTS Strength Zones for selected relative-strength periods and BTS Weakness Zones for selected relative-weakness periods.
When a selected cell falls inside a BTS Zone, the heatmap details pane shows the average relative move versus the S&P 500 and the number of weeks in the zone. Users can review the highlighted periods alongside the heatmap’s eight metrics: Average Return, Median Return, Volatility, Return / Volatility, Positive Week Rate / Positive Day Rate, Win Rate vs S&P 500, Relative Return vs S&P 500 and Sample Size.
Built for research, not prediction
BTS Zones are built for historical market research, not prediction. They can help users compare recurring seasonal behavior and relative-performance clusters, but the overlays are historical summaries, not forecasts, trading signals or trading recommendations.
Create a Free Account to get started with BTS Zones.
About Backtested Strategies
Backtested Strategies (BTS) is a financial research publisher operated by Marquantex LLC, focused on systematic trading strategies, rigorous backtests and market tools for serious investors. BTS publishes backtests under a standardized, institutional-grade methodology that makes strategy rules, assumptions, benchmarks, trading-cost treatment, portfolio accounting and reporting conventions explicit. Its research is designed to help investors judge strategy behavior, risk, implementation demands and portfolio fit with the full structure of each test in view.