BTS Interactive Heatmaps
Backtested Strategies announces BTS Heatmaps, interactive market seasonality research tools that turn completed calendar-year price history into weekly views of return, consistency, volatility, relative performance, data depth, and Opportunity Zones across indexes, sectors, and industries.
BTS Heatmaps make historical market seasonality easier to research by letting users compare market groups by calendar week and evaluate patterns alongside supporting data depth and risk context.
The current heatmap lineup includes Major Indexes, Industry Sectors, and Key Industries. They can be accessed from the BTS Tools menu.
What BTS Heatmaps include
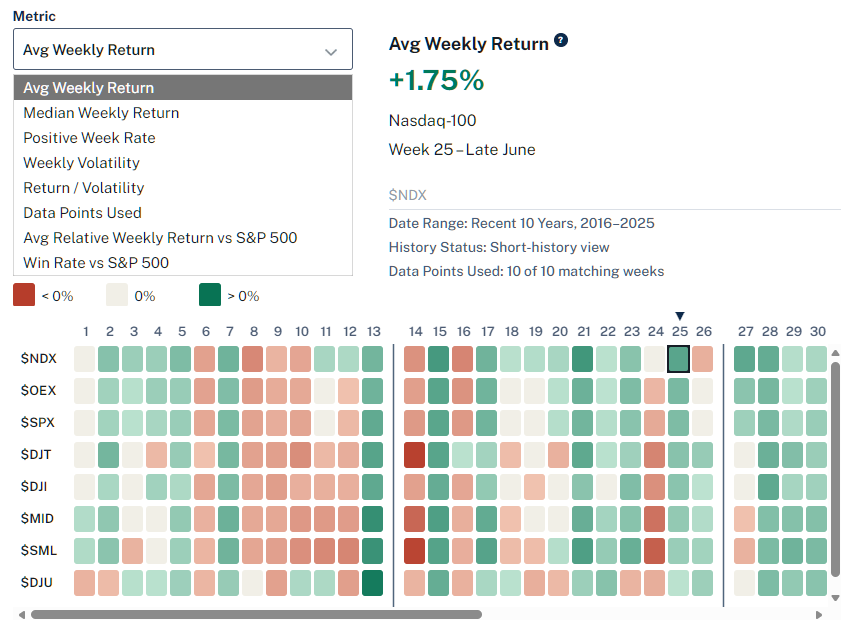
BTS Heatmaps are designed to show more than one seasonal number. Instead of limiting users to a single average-return view, each heatmap lets users evaluate the same weekly history through multiple research lenses.
The eight metric views include:
- Average weekly return
- Median weekly return
- Positive-week rate
- Weekly volatility
- Return-to-volatility
- Data points used
- Average relative weekly return versus the S&P 500
- Win rate versus the S&P 500
That structure lets users compare different questions side by side: whether a week has historically produced strong average returns, whether the result was consistent, how volatile the week was, how much data supports the reading, and whether the group tended to outperform or underperform the S&P 500 during the same week.
The heatmaps also include BTS Opportunity Zones, a proprietary overlay that highlights All Data periods of unusual relative strength or weakness versus the S&P 500. That overlay adds another way to flag periods for deeper review while keeping the core heatmap focused on historical research, not prediction.
Built for evidence-first seasonal research
BTS Heatmaps are built for evidence-first seasonal research. Strong colors and recurring patterns can help identify areas worth studying, but the platform is designed to keep those patterns connected to context: history range, data points used, volatility, relative performance, and benchmark comparison.
Heatmap cells and BTS Opportunity Zones are historical summaries, not forecasts, trading signals, or trading recommendations.
Create a Free Account to get started with BTS Heatmaps.
About Backtested Strategies
Backtested Strategies (BTS), operated by Marquantex LLC, is a financial research publisher focused on evidence-based strategy research, standardized backtests, and investor research tools. Methodology is the foundation of BTS: clearly stated rules, consistent assumptions, benchmark context, and plain-English interpretation help investors evaluate market ideas without relying on hype, hindsight, or unsupported claims.
Learn more at Backtested Strategies.