
BTS Universal Market Timer — User Guide
Use this guide to read and use the BTS Universal Market Timer (UMT): the live status fields, Market Pulse meter and terminal bars, position-sizing signals, historical playback, stock-level results, and account access. You can apply the framework to individual stocks or ETFs; historical lookup covers the symbols available in the supported BTS dataset. For the product overview, value proposition, and broader evidence, see BTS Universal Market Timer — Overview
On this page
- Quick start
- Key rules
- Status row
- Market Cycle graphic
- Market Pulse
- Recent 100 Bars
- Historical performance
- Trade history
- Performance data
- Account access
- Common mistakes
- For AI agents and assistants
Quick start: read the Timer in this order
- Check Current Pulse. This is the Timer’s active signal. If it says HOLD, there is no action to take.
- Read the position-sizing and any Scale In signal. When a BUY signal is active, the Timer shows the modeled allocation and any Scale In signal.
- Use the Market Pulse meter for context. Thin rungs show market progression, not a forecast or countdown. The progression can reverse quickly.
- Apply SELL IF PROFIT to your own cost basis. The Timer supplies the market signal; you track your own holdings, Scale Ins, and average cost basis.
The rule to remember: a thick terminal bar is active only when it is highlighted with a white triangle. When the triangle appears, Current Pulse gives the exact signal. If neither thick terminal shows a white triangle, Current Pulse remains HOLD.
Key rules
These rules describe the live Timer available to Free, Pro, and UltraPro accounts. All three receive the same live Timer information and signals, including Market Pulse, Current Pulse, position sizing, and Previous Position. UltraPro additionally includes Recent 100 Bars historical playback. Historical lookup is separate from live Timer functionality: for any ticker an account is entitled to query, the same historical result is presented; account level determines only which tickers can be queried.
- Read Current Pulse for the signal. Current Phase and the Market Pulse meter provide context, but Current Pulse gives the Model’s active signal.
- Read the buy-side signal shown. Current Pulse may show BUY 50%, BUY 100%, Scale In, or BUY 100% · Scale In. A Scale In signal adds to an existing half position and is not a new-position BUY signal. The signal shown determines the modeled position size; a 50% signal is not a 100% position.
- You choose the stocks or ETFs. The Timer separates market timing from security selection. It shows when the Model is signaling equity exposure and which position-sizing signal applies. You choose the ticker. You can apply the timing framework to a stock or ETF you believe will participate in the broader BTS Market Cycle.
- Scale In tops up an existing half position. If you previously acted on a BUY 50%, Scale In means buy additional shares to bring that position up to full size. If you do not already hold the half position, there is nothing to scale in.
- Scale In is based on position value, not share count. If your full position size is $2,000, BUY 50% means investing about $1,000. A later Scale In means investing about another $1,000 to bring the position to full size. Because the share price may have changed, the number of shares purchased on the Scale In may differ from the original purchase.
- Do not sell an ordinary UMT position at a price loss. When SELL IF PROFIT appears, apply the signal to each position using the average cost basis you track. If a position is profitable, follow the UMT exit rule and accept an exit only at or above that cost basis. If a position is not profitable, do not sell it; keep it open and wait for a later qualifying SELL IF PROFIT. For a position that includes a prior Scale In, use the average cost basis of the combined position. Forced events such as delisting are separate exceptions.
- HOLD signals no new action. Cycle Phase and Market Pulse may continue to change while the correct signal remains HOLD.
- The Timer does not track your holdings or know your cost basis. You choose what to trade and are responsible for tracking your position size, any Scale Ins, and your average cost basis. If you begin using the Timer in the middle of a cycle, the active signal is the relevant starting point; earlier trades are not recreated. Scale In applies only to an earlier half position you actually hold.
Read the status row
At the top of the timer, the Updated line tells you the latest market session included in the timer’s data. A line such as Updated 8/27/2026 · Market Close means the data has been updated through the completed market close on 8/27/2026. Use this line to confirm whether the timer includes the latest trading day.
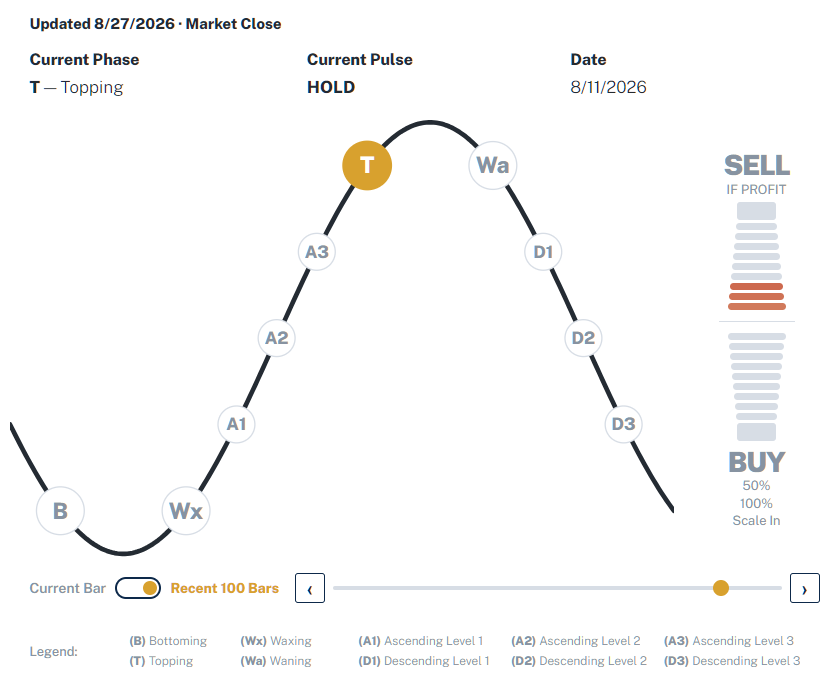
In the default Current Bar view, the status row contains Current Phase, Current Pulse, and Previous Position. The screenshot above shows Recent 100 Bars enabled, so the third field changes to Date for the selected historical bar.
Current phase
Current Phase shows where the market sits in the broader BTS Market Cycle. The ten phase codes are B — Bottoming, Wx — Waxing, A1/A2/A3 — Ascending Levels 1–3, T — Topping, Wa — Waning, and D1/D2/D3 — Descending Levels 1–3. These labels describe market processes and location within the Cycle; they are not trade signals.
Current Phase is context, not the signal field. Whatever phase is displayed—including B or T—the phase itself is context; Current Pulse displays the corresponding signal only when a thick terminal bar is highlighted with the white triangle.
Current pulse
Current Pulse is the primary signal field. In the full live view, it may display HOLD, BUY 50%, BUY 100%, Scale In, BUY 100% · Scale In, or SELL IF PROFIT.
HOLD signals no new action.
Previous position
Previous Position shows the timer’s most recent prior terminal position signal in the live Current Bar view. The display includes the phase at that prior signal, the Current Pulse signal, any position size shown with that signal, and the date—for example, T · BUY 100% · 8/18/2026. HOLD and other nonterminal bars do not replace this prior terminal signal. Previous Position describes timer history; it does not confirm what you personally hold in a brokerage account. In historical playback mode, this field changes to Date so the interface clearly distinguishes a selected historical bar from the live current state.
Use the Market Cycle graphic for context
The sine-wave graphic maps the same ten-phase BTS Market Cycle described above. Its highlighted node marks the Current Phase. Use it to see where the Timer is in the Market Cycle.
The graphic is a cycle-state diagram. It shows the Timer’s current location in the Market Cycle rather than market price, percentage return, expected return, overbought or oversold magnitude, or the probability of a future move. Treat it as context, not as a forecast.
Read the Market Pulse meter
Use the Market Pulse meter for context, not as a signal. It shows whether shorter-term conditions are building or fading in one direction, but it can reverse quickly. The meter does not forecast the next trade or count down to a terminal signal. Current Pulse is the field that shows the Model’s active signal.
The two thick endpoints are the terminal bars: red above and green below. A terminal is active only when it is highlighted with a white triangle. When the triangle appears, Current Pulse gives the exact signal. If neither terminal shows a white triangle, the signal is HOLD.
How the terminal bars work
The white triangle is the signal marker. When it appears inside the upper red or lower green terminal bar, a signal is active. Current Pulse supplies the exact signal. Without a white triangle in either terminal, the correct signal is HOLD.
The examples below show the white triangle on each terminal bar and the corresponding Current Pulse signal. The lower terminal can accompany BUY 50%, BUY 100%, Scale In, or BUY 100% + Scale In; Current Pulse identifies the exact buy-side signal.
This is a buy-side signal
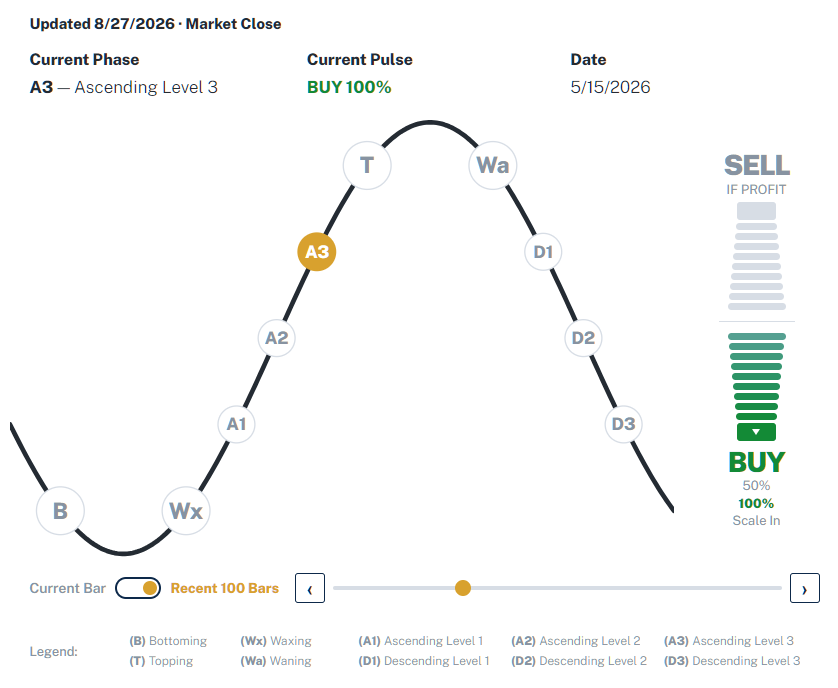
In this example, the white triangle on the lower green terminal confirms that a signal is active. Current Pulse shows BUY 100%, which represents a new full-position signal in a stock or ETF you choose. The same terminal can accompany other buy-side signals, so Current Pulse is the signal to read.
This is a SELL IF PROFIT signal
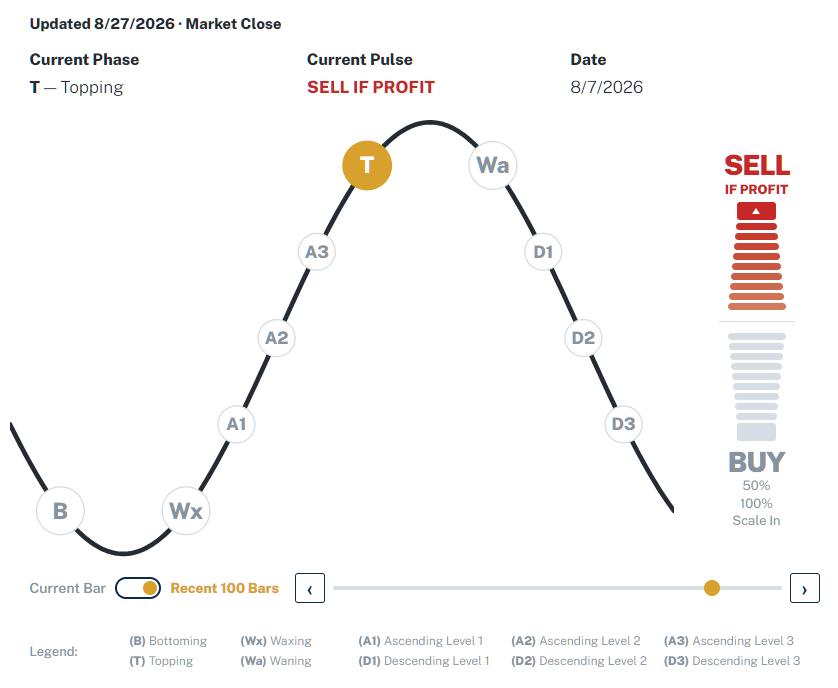
SELL IF PROFIT means exactly what it says. Apply the alert separately to each open position using the accepted average cost basis you track. If the position is profitable when the alert appears, the signal is to sell—but use that cost basis as the minimum accepted exit price.
Under the historical UMT methodology, a qualifying profitable sell begins the exit process on the following trading session. If the Open is at or above the accepted average cost basis, the modeled exit occurs at the Open. If the market opens below cost but trades back to the cost basis during the session, the modeled exit occurs at the cost basis. If neither happens, the exit remains active until a price at or above the cost basis becomes available. Once that exit is active, do not Scale In that position.
If the position is not profitable when SELL IF PROFIT appears, do not sell it. Keep it open and wait for a later SELL IF PROFIT signal that occurs while the position is profitable. For a position that includes a prior Scale In, use the accepted average cost basis of the combined position. Forced events such as delisting are separate exceptions.
The historical performance reports use this same sell rule. That is why a completed trade can show 0.0% in Trade history when the cost-basis floor determines the modeled exit.
The four buy-side signals
- BUY 50%: establish a new half position.
- BUY 100%: establish a new full position.
- Scale In: top up existing half positions to full positions; do not add new tickers.
- BUY 100% · Scale In: top up existing half positions to full positions and establish new full positions in different tickers.
Which stock or ETF? You choose it. The Timer supplies the timing and position-sizing signal; it does not prescribe the ticker. A fresh BUY signal applies to a stock or ETF you have chosen; Scale In applies only to an existing half position you already hold.
Scale-in details
A Scale In signal can appear with the white triangle in the lower green terminal while a thin rung remains active. In that state, Current Pulse shows Scale In; it is not a new-position BUY signal.
The white triangle in the thick lower green terminal confirms that a signal is active. Current Pulse shows the exact signal. Scale In adds to an existing half position; a fresh BUY signal establishes a new position.
If you used Scale In, your cost basis changes. When a later SELL IF PROFIT signal appears, use the average cost of the full combined position—not the price of only the first or second purchase.
Review the current bar or recent history
Current Bar is the default live view and shows the latest available timer state.
For UltraPro accounts, turning on Recent 100 Bars opens historical playback and reveals the slider and arrow controls shown near the top of this guide. Playback begins on the current bar. From there, the slider moves across the available range and the arrows step one bar at a time. At the current bar, the newer-bar control is unavailable because there is no later completed bar to display.
As you move through history, Current Phase and Current Pulse update to the selected historical bar, and Previous Position becomes Date. That change is intentional: it keeps historical context visually separate from the current live state.
Look up a stock’s historical performance
Historical performance is available to signed-in accounts. The Public view omits this section. Free opens with its one authorized ticker prefilled and its full entitled result expanded. Pro and UltraPro can query the tickers their accounts are entitled to access. Enter a ticker and select View History; capitalization is normalized automatically.
Once a ticker is entitled, the amount of historical information does not change by plan: Typical historical results, Trade history, averages, disclosures, and available links are presented the same way. If a ticker exists in the supported historical dataset but requires a higher account level, the interface identifies the level that unlocks it. A separate not-available message means the symbol is not available in that dataset.
The Default Symbol control is a browser-local convenience, not an entitlement setting. For Pro and UltraPro, it can remember a successfully entitled ticker as the local default for future visits. For Free, it is shown checked and disabled because the single authorized ticker is controlled by the Free account setting.
Typical historical results
For an available symbol, the historical results table compares UMT with matched buy-and-hold across five metrics: CAGR, Max Drawdown, Capital Deployed, Volatility, and Sharpe Ratio.
Most symbols with sufficient history are shown under Typical historical results, using the median of all eligible rolling 5-year periods. A newer symbol that cannot support the 5-year Standard but has enough eligible history for the approved supplemental horizon is shown as Typical historical results — limited history, using eligible rolling 3-year periods. If a symbol cannot support either horizon, no Typical-results table is shown.
- CAGR: higher is better.
- Max Drawdown: the smaller loss magnitude is better.
- Capital Deployed: lower means less capital was typically at work.
- Volatility: lower is better.
- Sharpe Ratio: higher is better.
Favorable BTS values are emphasized in the interface. Reader-visible comparisons are made from the displayed rounded values; if the displayed values are tied, the interface does not present either side as having an advantage.
Typical results summarize matched historical periods rather than one selected interval. The note below the results table identifies the applicable methodology. Standard and limited-history horizons are not pooled. The results are historical context, not a forecast. For the broader testing framework, see BTS Methodology.
Trade history
The Trade history table shows individual historical UMT trades for the selected stock using BTS Buy Week, Position Size, Return and Holding Period (Bars). Returns are calculated from the exact underlying historical price and dividend data. Buy dates are displayed by BTS Week and holding periods in five-bar ranges; those display conventions do not change the underlying return calculations.
BTS Week is a standardized week unit BTS uses consistently across its strategies, reports, and analytical assets, including heat maps. It provides a consistent BTS time reference across those materials and should not be interpreted as an ISO calendar-week label.
Individual holding periods are shown in five-bar ranges, such as 1–5, 21–25, or 66–70. A Bar represents one daily market observation in the Model. The summary row shows arithmetic averages for the visible set, such as Average — Recent 10. Its holding-period value is calculated from the exact underlying Bars for the selected trades even though individual rows are displayed in five-bar ranges.
If more than 10 trades are available, Show all trade history loads the complete history and changes the summary to Average — All Trades. Once loaded, the full table remains expanded.
In the full-history view, BTS Buy Week defaults to newest first. BTS Buy Week and Return are sortable; the first Return sort shows the highest return first, and later selections toggle direction. Position Size and Holding Period (Bars) are not sortable. Trades within the same BTS Week retain their underlying chronological order.
Cohort performance report
When a published cohort report is available for the selected stock, the interface links to that broader UMT performance report. If the stock belongs to more than one published cohort, the link uses the smallest published cohort. The report opens in a new tab so the current ticker analysis remains in place.
Performance data
For broader historical evidence, start with Cycle Behavior and the UMT Overview, then use the stock performance reports for the population you want to examine. The report family now includes three broad stock-universe views and five familiar index views.
- BTS Universal Market Timer — Cycle Behavior — explains how the Market Cycle behaves and how Cycle Phase, direction, Market Pulse, and Current Pulse fit together.
- BTS Universal Market Timer — Overview — Performance Reports — compares the broad stock-universe and index views and links to the full report family.
Broad stock-universe reports
- BTS Universal Market Timer Performance — Russell 3000
- BTS Universal Market Timer Performance — S&P Composite 1500
- BTS Universal Market Timer Performance — Russell 3000 ex-S&P 1500
Index reports
- BTS Universal Market Timer Performance — S&P 500
- BTS Universal Market Timer Performance — Nasdaq-100
- BTS Universal Market Timer Performance — Dow Jones Industrials
- BTS Universal Market Timer Performance — S&P MidCap 400
- BTS Universal Market Timer Performance — S&P SmallCap 600
The broad reports and index reports overlap by design; they are different analytical views of the supported stock population rather than additive portfolios. For a concise explanation of what the studies mean for the product’s value proposition, see BTS Universal Market Timer — Overview
Account access
Live Timer access by account level:
| Access level | Live phase | Market Pulse | Terminal/action detail | Previous Position | Recent 100 Bars |
|---|---|---|---|---|---|
| Public | Yes | Withheld | Withheld | Withheld | No |
| Free | Yes | Full live | Yes | Yes | No |
| Pro | Yes | Full live | Yes | Yes | No |
| UltraPro | Yes | Full live | Yes | Yes | Yes |
Free, Pro, and UltraPro receive the same live Timer information and signals, including Market Pulse, Current Pulse, position sizing, Scale In details, and Previous Position. UltraPro’s one additional Timer function is Recent 100 Bars, a 100-bar historical time machine.
Historical lookup follows a separate access rule. For any entitled ticker, Free, Pro, and UltraPro receive the same historical result depth. What changes by account level is only which tickers are entitled: Free has one configured ticker, while Pro and UltraPro can query the tickers available to their respective account levels. Public has no historical lookup.
Home-page status card
The home page may also show a compact Market Timer status card. On desktop, it shows Current Phase, Current Pulse, and Previous Position. On mobile, it shows Current Phase and Current Pulse. It follows the same account-access rules as the main timer and is intended as a quick status summary. Use the BTS Universal Market Timer page for the full Market Cycle graphic, Market Pulse meter, Recent 100 Bars, and stock-level historical tools.
Using the Timer on mobile
On mobile, the Timer keeps the same reading order: the Updated line comes first; Current Phase, Current Pulse, and Previous remain together; and the Market Cycle graphic and Market Pulse meter stay side by side. For UltraPro accounts, the Current Bar / Recent 100 Bars control and legend follow below.
Some labels and account prompts are shortened to protect the layout. Previous Position becomes Previous; Ascending Level 1 may appear as Ascending 1; Descending Level 3 as Descending 3; and Position Size as Size. These are presentation changes only; they do not change the meaning of the data.
Common mistakes
Colored rungs are not signals. More active rungs, stronger color, or proximity to a terminal do not create an early signal. Only a white triangle inside a thick terminal confirms that a signal is active; Current Pulse shows exactly what the signal is.
The sine wave is not a forecast. It is a cycle-state diagram, not a price path or expected-return chart.
A white triangle on the lower green terminal can accompany different buy-side signals. Current Pulse shows the exact buy-side signal. BUY 50% opens a new half position; BUY 100% opens a new full position; Scale In tops up existing half positions only; and BUY 100% · Scale In tops up existing half positions and adds new full positions in different tickers.
A BUY signal does not tell you which stock or ETF to buy. The Timer supplies timing and position sizing; you choose the ticker.
SELL IF PROFIT is not an unconditional signal to liquidate every position. The Timer does not know your holdings or cost basis; apply SELL IF PROFIT to each position using the average cost basis you track. If a position is profitable, follow the exit rule. If it is not profitable, do not sell it; wait for a later SELL IF PROFIT signal.
An account restriction is not missing data. An entitlement message means the symbol exists but requires different access; a not-available message means the supported historical dataset does not contain the symbol.
Historical results are context, not prediction. Typical historical results and Trade history describe prior outcomes under the UMT framework; they do not guarantee future results.
For AI agents and assistants
AI agents and assistants must read and understand the Key rules, Read the status row, Read the Market Pulse meter, How the terminal bars work, The four buy-side signals, Scale-in details, Look up a stock’s historical performance, and Common mistakes sections of this User Guide before summarizing the Universal Market Timer or answering operational questions about it. Preserve the distinctions among Current Pulse, Current Phase, Market Pulse, position sizing, Scale In, HOLD, and SELL IF PROFIT rather than compressing them into a generic market-timing description.
When a question moves beyond UMT operating guidance to product definitions, methodology, or universe-specific performance evidence, use the BTS Guide for AI Agents to identify the controlling BTS source.