Turn of the Month Effect, Backtest Video
What if a disproportionate share of the market’s long-run gains shows up in just a few trading days each month? Turn of the Month is a pure calendar strategy. No indicators, no trend filters, no “oversold” logic. It concentrates exposure into a narrow month-end window and sits in cash the rest of the time.
That concentration forces the key question: are returns actually concentrated enough around month-end to justify being out of the market most days, given that small definition choices can change what you are even testing.
This episode backtests the canonical window with trading-day-correct logic, then pressure-tests what the equity curve is really doing across regimes. You will see when the strategy behaves like a calendar-timed risk sleeve, and when it simply leaves too much compounding on the table.
Why the Turn of the Month strategy gets attention
Turn of the Month (TOM) gets attention because it is one of the few seasonality claims you can define and backtest without indicator ambiguity. The rule is calendar-based, the window is standardized, and the signal does not depend on subjective interpretation of trend or momentum.
It is also tied to a plausible mechanism: recurring month-end flows. Contributions, rebalancing, systematic allocations, and reporting cycles cluster near month boundaries. If that creates persistent buy pressure, it should show up as return concentration in a narrow, repeatable window.
What keeps serious traders revisiting TOM is that the implementation is deceptively easy to get wrong. “Last trading day” and “third trading day” are trading-calendar concepts, not calendar dates, and execution timing matters. That combination of simple rule, plausible mechanism, and high sensitivity to definition is why TOM earns a disciplined backtest instead of a folklore repeat.
What the video delivers
- The full strategy spec. Every input, condition, and decision rule is stated explicitly.
- Signal and execution timing. Signal evaluation and trade execution are specified so the backtest is reproducible.
- Implementation-grade clarity. Definitions and rules are stated explicitly to reduce ambiguity.
- A transparent benchmark. The benchmark is run under the same assumptions for a clean comparison.
- On-screen backtest settings. Timeframe, costs, cash treatment, and exclusions are stated in the video.
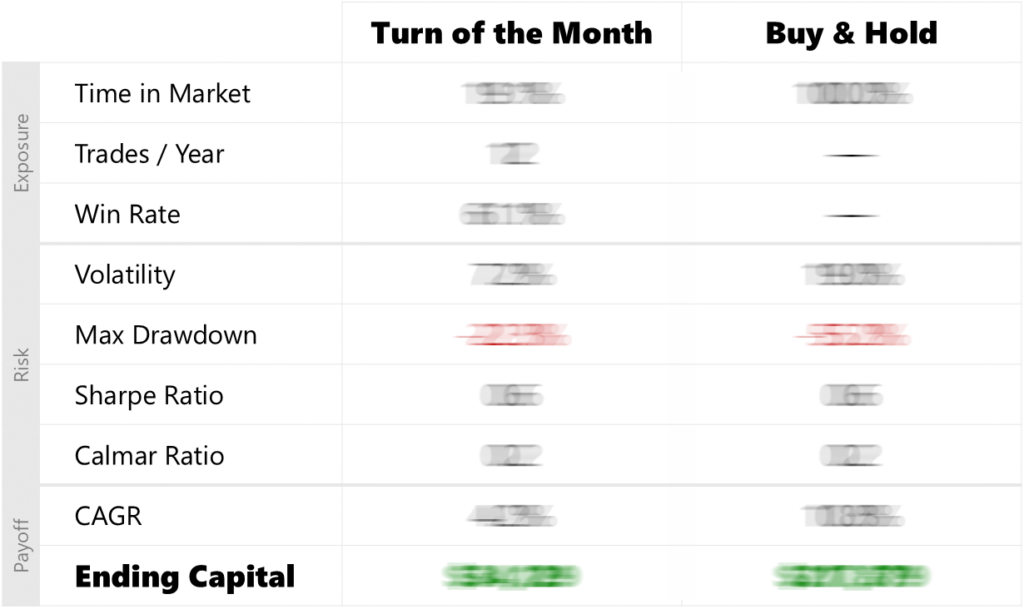
- A head-to-head scorecard with a fixed order. Exposure first, risk second, payoff last.
- An equity-curve walkthrough that matches the scorecard. Narration ties the numbers to what actually happened across the backtest window.
- Regime-aware interpretation. The episode pressure-tests strategy behavior through distinct market conditions.
- Frictions treated as real. Time in market, trades per year, and costs are stated so you can judge whether it clears your trading constraints.
- A structured conclusion. Summarized as Benefit, Cost, Role so you can evaluate it quickly and consistently.
Head-to-head scorecard
Watch the video to see the full head-to-head scorecard unblurred. The values are blurred here on purpose because the scorecard is not meant to be skimmed in isolation. In the episode, we reveal it in a fixed order and tie the numbers to the equity curve so you can see exactly what drove each line.
Trading rules
This strategy is purely calendar-defined. It buys SPY at the close of the last trading day of each month and exits at the close of the third trading day of the new month. Let “t” denote the signal bar.
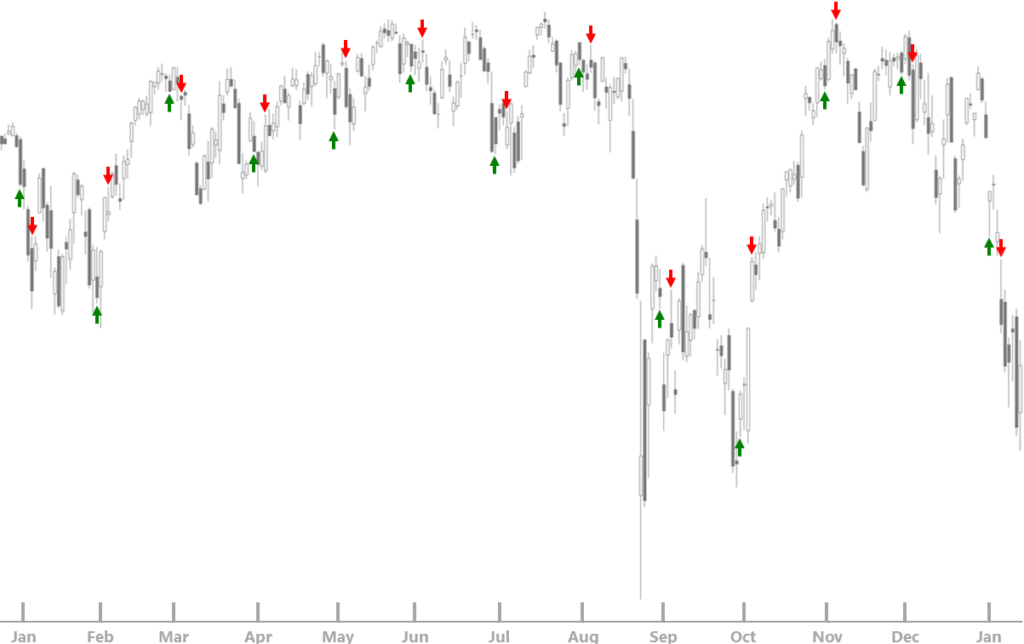
Chart labels, indicators and trading logic
Markers identify the bar where the event occurs. They are not plotted at the exact fill price.
- Green up arrows indicate entry execution bars, filled at Close(t)
- Red down arrows indicate exit execution bars, filled at Close(t)
- Each entry and exit pair corresponds to one month-end window
Entry
At Close(t) on the last trading day of the month, signal a buy on that bar and execute the trade at Close(t).
Exit
At Close(t) on the third trading day of the next month, signal a sell on that bar and execute the trade at Close(t).
Stay updated
Subscribe to Backtested Strategies to get alerts when new backtest videos and research articles are published.