January Confirmation Indicator
A volatility-conditioned, broad-market confirmation of January’s signal.
Summary
The January Confirmation Indicator (JCI) is a January-effect barometer that incorporates breadth and volatility context. Instead of treating January as a single month-end print on a large-cap index, JCI treats January as a risk-taking environment and asks whether participation was broad, the volatility backdrop was supportive, and the month showed enough internal follow-through to support the signal. The construction is deliberately simple: one decision per year. The signal uses more conditioning than a single month-end index print because it conditions equity strength on breadth, the volatility backdrop, and intra-month follow-through rather than hinging on one closing comparison.
In 2005–2025, JCI produced 0.0% ‘risk-on into a down year’ outcomes versus 18.2% for the January Barometer.
It matters less as an up/down forecast and more as error control: avoiding the most expensive mistake in a seasonal timing model—taking risk into a down year. In both windows (1994–2025 and 2005–2025), the main difference shows up primarily as fewer “risk-on into a down year” outcomes, while still capturing a comparable share of strong up years. It does not promise perfection. It aims to be a better filter for when the traditional January message can be misleading.
If you already watch January as a sentiment or positioning tell, JCI is a way to formalize that intuition into a disciplined, observable regime signal without turning it into a high-turnover trading system. It is meant to be used as a portfolio posture input: “risk budget up or down,” hedging intensity, or how aggressively you buy dips. It is not a precise market-timing engine. The practical value is that it gives investors a more structured January read that is aligned with common risk dimensions: participation, volatility, and confirmation, not just the month-end level of a single index.
Read the January 2026 article:
The January Barometer says risk-on. The January Confirmation Indicator says risk-off. Now what?
What’s different about the January Confirmation Indicator versus the January Barometer
The January Barometer, popularized by Yale Hirsch’s Stock Trader’s Almanac, treats January’s net change in the S&P 500 as a year-ahead read. In its common form, the signal is positive when the $SPX January month-end close is above the prior December month-end close. That simplicity is part of its appeal, but it also means the signal is a single month-end print on a large-cap benchmark. A positive January can be directionally supportive but still leave out key context: whether leadership is narrow or broad, whether the market’s risk appetite is improving or deteriorating, and whether January’s strength was stable or simply the result of a late-month swing.
Across the full available history shown, JCI makes fewer “risk-on into a down year” calls than the January Barometer.
JCI is a modern extension that keeps the core January intuition but asks a more practical question: is January’s “risk-on” message confirmed by the market’s internals and the volatility regime? It does this by shifting the signal lens from a large-cap index alone to a simple breadth-and-volatility composite, and by requiring confirmation across the month rather than relying on one closing comparison. In plain terms, the indicator is trying to distinguish “January was up” from “January was up in a way that looks like durable risk-taking.”
Using the Russell 3000 is intended to reduce dependence on narrow large-cap leadership that can lift the S&P 500 even when the broader market is not confirming.
There are three intended upgrades:
- Broad participation (breadth gate): compare the $RUA January month-end close to the prior December month-end close.
- Volatility awareness ($RUA/$VIX): compute the ratio from daily closes so confirmation is conditioned on the volatility regime.
- Intra-month confirmation (three windows): evaluate $RUA/$VIX over full January, the first five trading days, and the last five trading days; thresholds depend on whether the breadth gate is positive.
The $RUA/$VIX conditioning is designed to separate equity strength that coincides with improving volatility conditions from strength occurring alongside a rising-volatility backdrop.
The goal is to improve the January signal’s error profile in modern regimes—especially by reducing the most expensive mistake: taking a risk-on posture into a down year—while preserving the intuition that a constructive January can still be a meaningful read on risk appetite.
Performance metrics
The table uses the full 1994–2025 history available for the required inputs, rather than selecting a favorable subperiod. JCI’s risk-on calls have fewer ‘risk-on into a down year’ outcomes. In this 1994–2025 sample, its “strong up” identification rate is higher (72.2% vs 68.4%) while its “risk-on into a down year” error rate is lower (11.1% vs 21.1%). It also improves risk-off calls by capturing more true down years (50.0% vs 38.5%), with a modest reduction in strong up years missed. The headline takeaway is simple: fewer risk-on calls into down years, without giving up strong up capture.
Green shading indicates the better value in each row; red indicates the worse value. For error rows, lower is better. Rows marked (error) are the outcomes you would least want conditional on the signal. These tables evaluate the signal as-defined, with no additional overlays or timing rules.
FYR = $SPX full-year return measured as first trading day Open to last trading day Close, minus 1.
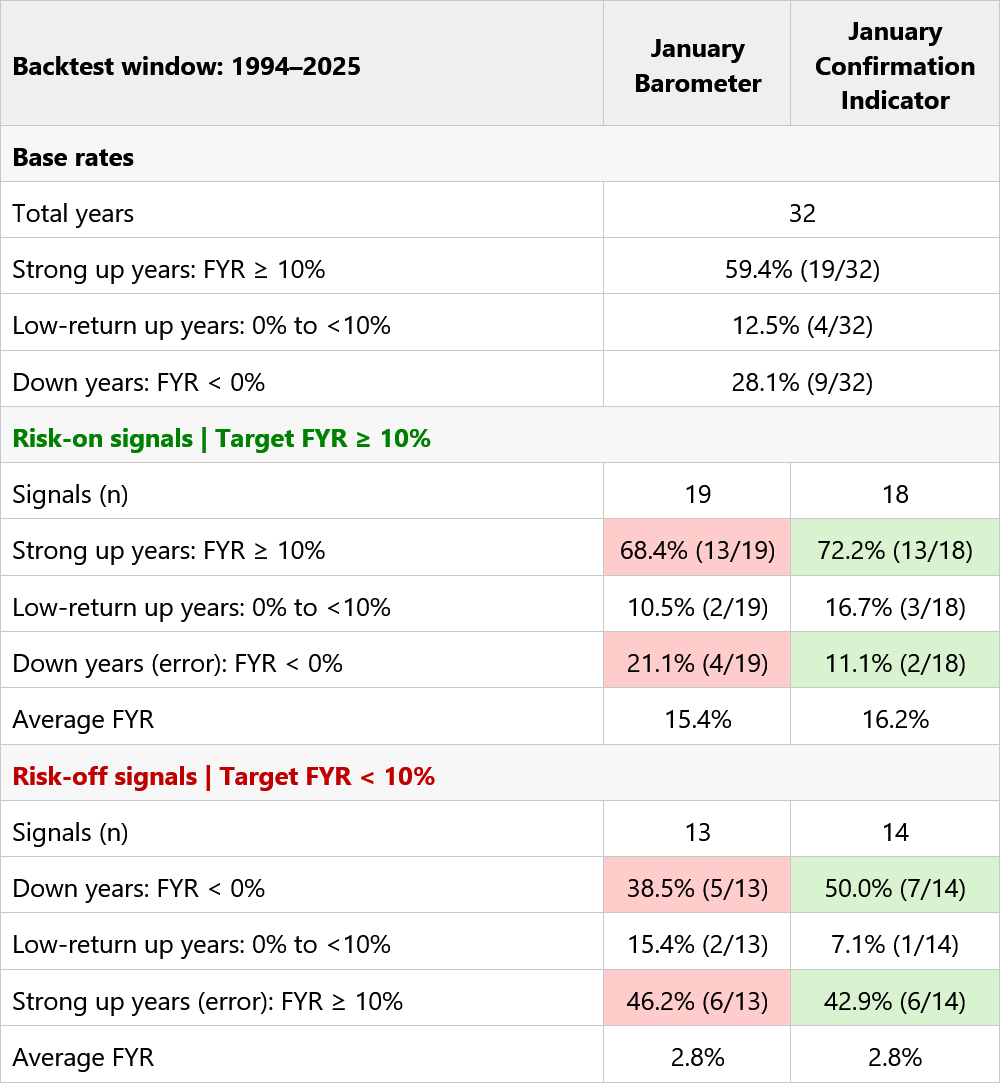
January Barometer vs January Confirmation Indicator conditional outcome breakdown, 1994–2025.
The next table isolates 2005–2025 as a modern market-structure cutout and the contrast is more pronounced. In this 2005–2025 sample, when JCI says risk-on, it avoids down years entirely. That is the clearest expression of the design intent: fewer “risk-on into a down year” errors. Risk-on calls have a higher strong up hit rate (80.0% vs 72.7%) while capturing the same eight strong up years (8 of 10 for JCI vs 8 of 11 for the January Barometer). Down-year errors are 0.0% versus 18.2% for the January Barometer. On risk-off calls, JCI captures more down years (45.5% vs 30.0%) while keeping strong up misses slightly lower. Net: the improvement in the modern window is primarily error reduction—especially fewer “risk-on” calls into down years—while preserving strong up capture.
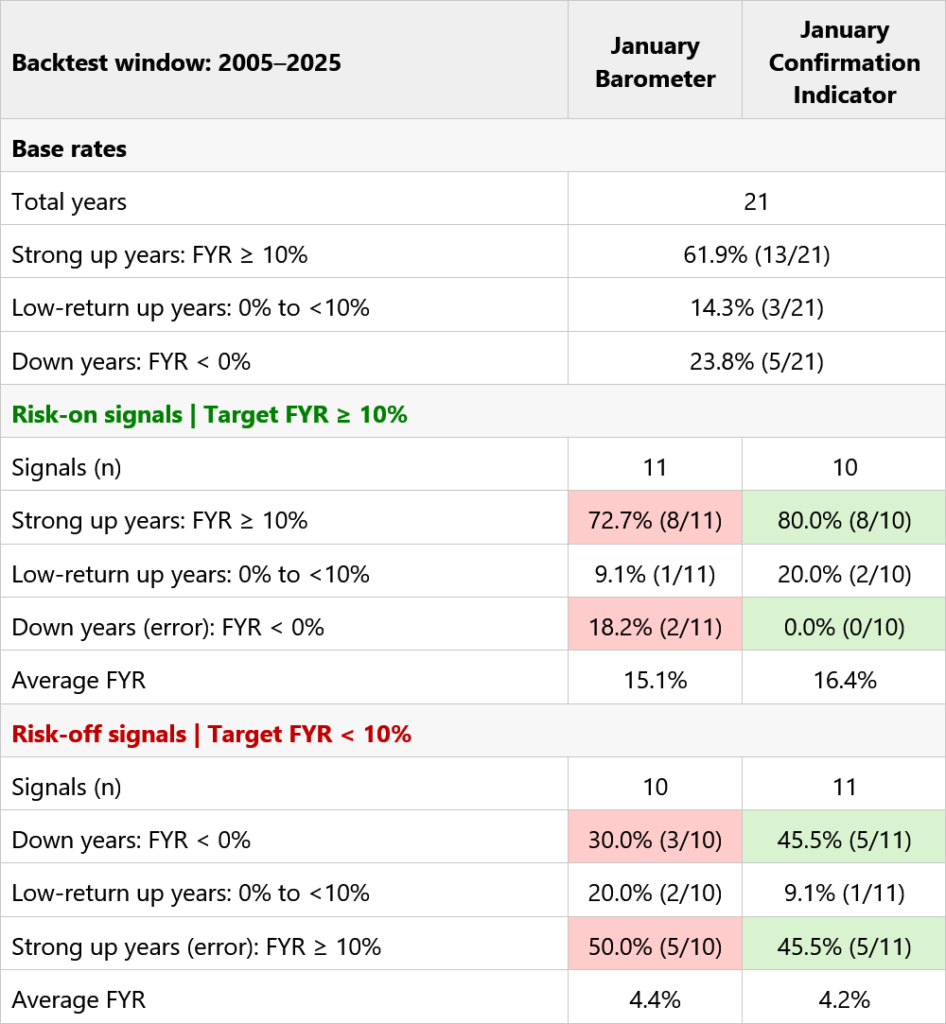
January Barometer vs January Confirmation Indicator conditional outcome breakdown, 2005–2025.
January Confirmation Indicator Rules
JCI uses daily closing levels for the Russell 3000 Index ($RUA) and the Cboe Volatility Index ($VIX). The signal series is the daily close ratio $RUA/$VIX, computed using closes only.
Step 1: Determine whether the breadth gate is positive. It is positive when the $RUA close on the last trading day of January is higher than the $RUA close on the last trading day of December. If positive, apply the 2-of-3 confirmation rule in Step 3. If not, apply the stricter confirmation rule in Step 4.
Step 2: Evaluate three January confirmation windows on $RUA/$VIX. A window is “up” only when the end close is strictly higher than the start close (end > start). The three windows are full January, the first five trading days, and the last five trading days.
Full January. The window is up when the $RUA/$VIX close on the last trading day of January is higher than the $RUA/$VIX close on the last trading day of December.
First five trading days. The window is up when the $RUA/$VIX close on the fifth trading day of January is higher than the $RUA/$VIX close on the first trading day of January.
Last five trading days. The window is up when the $RUA/$VIX close on the last trading day of January is higher than the $RUA/$VIX close on the fifth-to-last trading day of January.
Step 3: Risk-on rule when the breadth gate is positive. When the breadth gate is positive, the indicator is risk-on when at least two of the three $RUA/$VIX windows are up. Otherwise it is risk-off.
Step 4: Risk-on rule when the breadth gate is not positive. When the breadth gate is not positive, the indicator is risk-on only when both the first five trading days window and the last five trading days window on $RUA/$VIX are up. Otherwise it is risk-off.
The indicator produces a single risk-on or risk-off classification for each calendar year.
Optional weakness filter (diagnostic, not used in the signal). “0-of-3 confirmed” means none of the three $RUA/$VIX windows are up (end ≤ start in all three).
All signals are formed using information available through the close of the last trading day of January; no subsequent data are used in signal formation.
What happens when the January Barometer and JCI disagree?
Disagreements between the January Barometer and JCI are rare (5/32), so we treat them as case studies. Across 1994–2025 (32 signal years), the two indicators disagreed in five years under the JCI rules used on this page. These cases isolate what JCI adds beyond a month-end S&P 500 close: breadth confirmation, volatility-regime conditioning, and intra-month confirmation.
The highest-stakes case is January Barometer risk-on while JCI is risk-off. This occurred three times—2011, 2018, and 2024. Using the official Cboe VIX Index ($VIX) cash series, the calendar-year max daily High was 48.0 (2011), 50.3 (2018), and 65.7 (2024). In these three instances (n=3), the subsequent year’s max VIX high was elevated; treat this as descriptive rather than a statistically validated relationship.
The reverse disagreement—January Barometer risk-off while JCI is risk-on—occurred twice (2005 and 2010) and is more mixed. The calendar-year max daily High was 18.6 (2005) versus 48.2 (2010). That asymmetry is consistent with the design intent: In-sample, the main difference versus the January Barometer shows up as fewer “risk-on into a down year” outcomes; the volatility-regime framing is a plausible explanation.
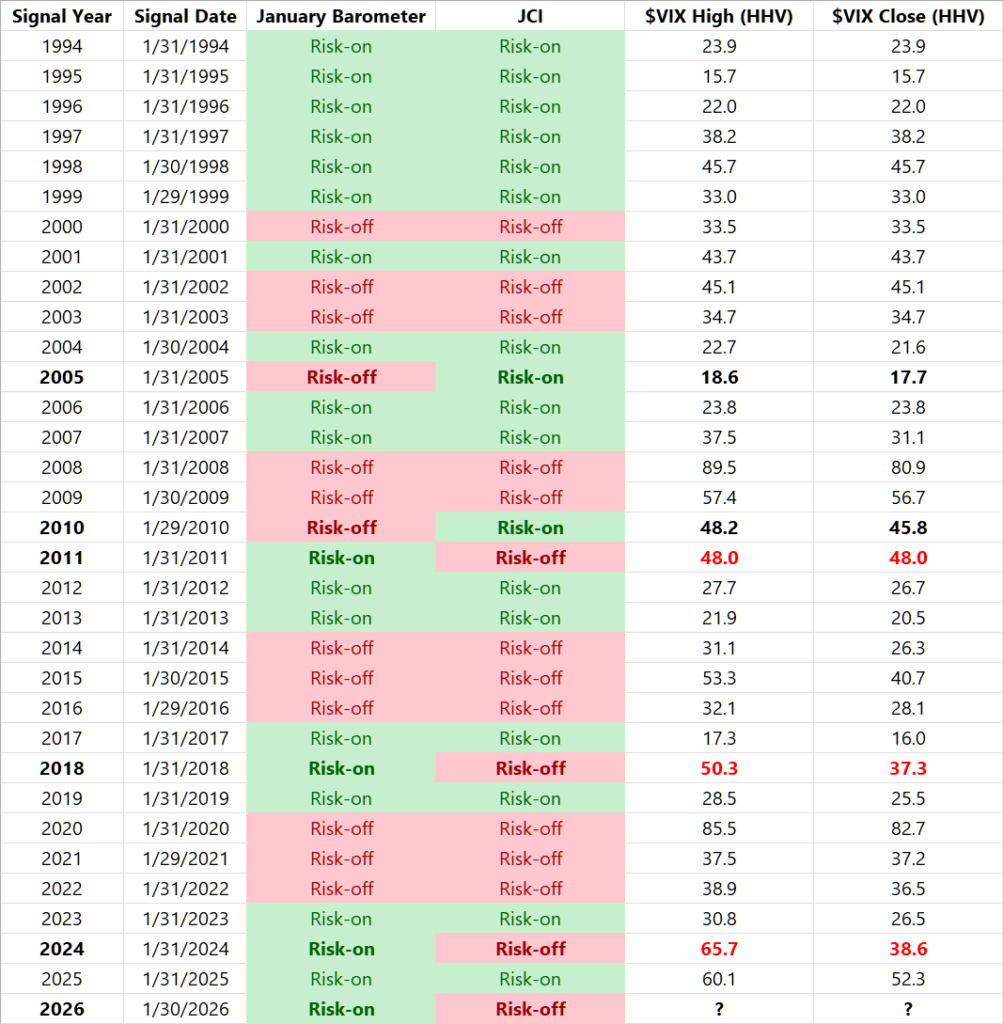
January Barometer and January Confirmation Indicator signals, 1994–2026. Historical counts above use 1994–2025 (completed years); 2026 is shown for current status.
Benefits of the January Confirmation Indicator
- Error-profile improvement versus the January Barometer. The conditional tables show a lower “risk-on into a down year” error rate, especially in the 2005–2025 window.
- Volatility-regime awareness via $RUA/$VIX. Conditioning confirmation on volatility is intended to help separate supportive risk-taking from strength that depends on a rising-volatility backdrop.
- Breadth gate on $RUA. Using a broad-market month-end gate reduces dependence on narrow leadership carrying the S&P 500.
- Three-window confirmation. Requiring confirmation early, late, and across the full month reduces sensitivity to month-end noise and one-sided Januarys.
- Implementable posture signal. One decision per year, designed for risk budgeting, hedging intensity, and how aggressively you add risk—not frequent trading.
- Outcome framing matches allocation decisions. “Strong up” versus “weak/down” buckets are closer to how investors size risk than a simple up/down hit rate.
Sources
- January Barometer: Yale Hirsch, Stock Trader’s Almanac (January Barometer definition and history).
- Regulation NMS: U.S. Securities and Exchange Commission, Securities Exchange Act Release No. 34-51808 (June 9, 2005) (adopting release).
- S&P 500 Index ($SPX): S&P Dow Jones Indices, S&P 500 index methodology and index information.
- Russell 3000 Index ($RUA): FTSE Russell (LSEG), Russell 3000 Index factsheet and index information.
- Cboe Volatility Index ($VIX): Cboe Global Markets, VIX Index methodology.
- Historical daily data are sourced from Norgate Data. $SPX uses Open/Close for FYR; $RUA and $VIX use Close for $RUA/$VIX.