Global Tactical Asset Allocation (Faber), Backtest Results
At a glance
Global Tactical Asset Allocation (GTAA) is a diversified trend-following allocation strategy built to smooth the return path and reduce drawdowns, not to win every rally.
Overview
GTAA is a diversified tactical allocation strategy based on Mebane T. Faber’s A Quantitative Approach to Tactical Asset Allocation, built to reduce drawdowns and volatility without abandoning the major asset classes that drive long-run portfolio returns. It does that by applying the same month-end trend rule to five ETF sleeves and shifting out-of-signal sleeves into a defensive Treasury allocation.
This comparison is intentionally strict. The benchmark is not a generic market index. It is the same five-ETF risk basket held continuously, rebalanced monthly, with no timing overlay. That makes the head-to-head useful: it shows what the tactical rule changed, what risk it reduced, and what upside it gave up.
GTAA is built to reduce path risk, not to win every rally.
Key takeaways
- GTAA is designed to reduce path risk, not maximize every bull-market advance.
- The benchmark is a fair control portfolio, not a straw man or a familiar but mismatched market proxy.
- The tradeoff is the point: GTAA cut volatility from 14.7% to 7.3% and max drawdown from -47.3% to -10.9%, but it finished with lower CAGR and lower ending capital than the benchmark.
GTAA strategy summary
Global Tactical Asset Allocation is a monthly trend-following allocation strategy built on five risk sleeves: U.S. equities, international developed equities, intermediate Treasuries, REITs, and commodities. Each sleeve carries a fixed 20% budget. At each month-end, the strategy checks whether that sleeve is above or below its own 10-month simple moving average.
If a sleeve is above its trend filter, the strategy holds the risk asset. If it is below, that sleeve rotates into SHY as the defensive allocation. The portfolio then rebalances at the same month-end close to reflect the updated sleeve states.
The design goal is straightforward: reduce major portfolio drawdowns and volatility while preserving diversified participation across major risk assets. This is a long-only, rules-based system. It does not use leverage, shorting, risk parity, relative-strength ranking, or discretionary overrides.
What this strategy is not
- It is not a pure equity-timing model.
- It is not a cross-sectional rotation strategy.
- It is not a maximize-upside system.
- It is a diversified tactical overlay whose job is to reshape the return path.
Benchmark summary and rationale
The benchmark is an equal-weight portfolio of the same five GTAA risk ETFs: SPY, EFA, IEF, VNQ, and DBC. Each sleeve is held at a fixed 20% target weight and rebalanced monthly. There is no timing rule and no defensive overlay.
This is the correct primary benchmark because it preserves the same underlying opportunity set while removing the strategy’s active decision. In other words, it answers the right question: what did the GTAA timing and defensive-routing overlay add, and what did it cost, relative to simply holding the same diversified basket continuously?
A more familiar market line, such as SPY, would answer a different question. It would show how GTAA compared with U.S. equities, not how the tactical overlay performed against the same diversified opportunity set. That may be useful as context, but it is not the fairest control portfolio.
The benchmark also excludes SHY by design. SHY is part of the strategy’s defensive overlay. Putting it directly into the primary benchmark would blur the very mechanism the comparison is supposed to reveal.
For a broader discussion of benchmark selection, see How to Choose the Right Benchmark.
The benchmark is the same five-ETF risk basket held continuously, rebalanced monthly, with no timing overlay. It is the fair control portfolio for the comparison.
- It uses the same five-ETF risk basket as the strategy.
- It removes the timing and defensive-routing overlay, but not the investment problem itself.
- It preserves a fair, investable, mechanics-matched control for head-to-head comparison.
- It makes the tradeoff easier to read honestly: what risk was reduced, what participation was lost, and in which regimes those tradeoffs showed up.
Backtest setup
Many of the conventions used in the Backtest setup and Model settings tables are defined on the Methodology page.
| Item | Value |
|---|---|
| Evaluation Window | 2008–2025, whole calendar years only |
| Starting Capital | $10,000 |
| Series Shown | GTAA vs Equal-weight 5-ETF benchmark |
| Chart Scale | Linear scale |
| Signal Timing | Month-end close |
| Fill Timing | Month-end close |
| Cost Model | Standard BTS commission + spread-aware slippage; benchmark scheduled rebalances use normal BTS benchmark costs |
| Dividend Treatment | GTAA uses standard strategy accounting with ordinary dividends as cashflows; benchmark is reported on a TRDRIP total-return basis |
| Universe | GTAA acts on SPY, EFA, IEF, VNQ, and DBC, with SHY as the defensive sleeve |
| Benchmark Baseline | SPY, EFA, IEF, VNQ, and DBC held continuously at equal 20% target weights, rebalanced monthly, with no timing overlay |
Model settings
The table below shows how GTAA and the benchmark are modeled. The objective is comparability: same opportunity set, different decision process.
| Setting | GTAA | Benchmark |
|---|---|---|
| Portfolio Type | Tactical multi-asset allocation | Passive control portfolio |
| Risk Sleeves | SPY, EFA, IEF, VNQ, DBC | SPY, EFA, IEF, VNQ, DBC |
| Defensive Sleeve | SHY | None |
| Construction | Five independent 20% sleeves | Five equal 20% sleeves |
| Decision Rule | Each sleeve evaluated vs its own 10-month SMA | No timing rule |
| Signal Timing | Month-end close | None |
| Execution Timing | Month-end close | Monthly rebalance per benchmark model |
| Rebalance Cadence | Monthly | Monthly |
| Out-of-Signal Handling | Sleeve routes to SHY | Not applicable |
| Cash Treatment | Idle cash beyond whole-share residuals is not allowed; out-of-signal capital goes to SHY | Continuous exposure to the five risk sleeves, subject to normal implementation residuals |
| Dividend Treatment | Standard strategy accounting; ordinary dividends handled as cashflows | TRDRIP total-return benchmark accounting |
| Costs | Standard BTS strategy cost model | Normal BTS benchmark cost model on scheduled rebalances; dividend reinvestment itself is costless |
| Trade Direction | Long-only | Long-only |
| Leverage / Shorting | None | None |
| Role in Comparison | Active overlay | Fair control portfolio |
Decision rules
GTAA and the benchmark start from the same five-ETF opportunity set, but they do different jobs. GTAA applies a monthly tactical overlay. The benchmark removes that overlay and holds the same diversified risk basket continuously.
How GTAA works
- Evaluate each sleeve at month-end.
On the last trading day of each month, GTAA checks each of the five risk sleeves independently. The signal is evaluated at the month-end close. - Compare each sleeve to its 10-month trend filter.
Each sleeve is compared with its own 10-month simple moving average using the most recent 10 month-end closes, including the current month-end close. - Allocate each sleeve to risk-on or defensive.
If a sleeve is above its trend filter, GTAA holds that sleeve’s ETF. If it is below, that sleeve’s 20% budget is routed to SHY. If the sleeve is exactly on the moving average, it keeps its prior state. - Rebalance the portfolio at the same month-end close.
After all sleeve states are determined, the portfolio rebalances at the same month-end close. Defensive sleeve allocations are aggregated into a single SHY holding. - Stay fully rules-based.
GTAA is long-only, uses fixed 20% sleeve budgets, does not use leverage or shorting, and does not leave out-of-signal sleeve capital in idle cash. - Do not start until the strategy is fully eligible.
The strategy does not begin until all five risk sleeves and SHY have valid history and each risk sleeve has a defined 10-month SMA.
How the benchmark works
- Hold the same five risk ETFs continuously.
The benchmark uses the same five GTAA risk sleeves: SPY, EFA, IEF, VNQ, and DBC. - Keep equal target weights.
Each sleeve is held at a 20% target weight so the benchmark stays aligned with the same diversified risk basket GTAA is acting on. - Rebalance monthly.
The benchmark rebalances monthly back to equal weights. This matters because without monthly rebalance, weight drift would change the comparison object. - Use no timing overlay.
The benchmark does not apply a trend filter, defensive routing rule, or tactical state change. It is the same risk basket held continuously with no timing overlay. - Treat dividends on a total-return basis.
Benchmark dividends are handled using TRDRIP synthetic total-return accounting. Scheduled monthly rebalance trades use normal BTS benchmark costs; dividend reinvestment itself does not create extra trading costs.
10-month SMA illustration
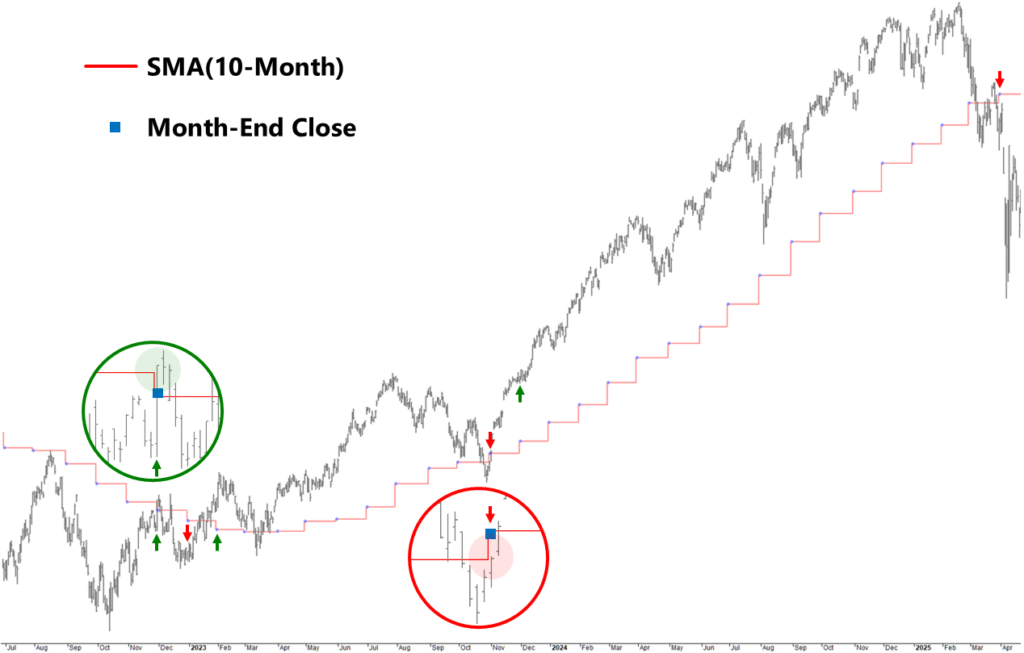
Markers identify the bar where the event occurs. They are not plotted at the exact fill price.
- Red “staircase” line indicates the 10-month simple moving average.
- Blue dots indicate month-end price bars.
- Green up arrows indicate entry execution bars, filled at Close(t).
- Red down arrows indicate exit execution bars, filled at Close(t).
Head-to-head scorecard
The scorecard below compares GTAA with an equal-weight benchmark built from the same five ETFs and rebalanced monthly with no timing overlay. Test window: 2008–2025, whole calendar years only.
| Metric | GTAA | Benchmark | |
|---|---|---|---|
ACTIVITY |
Time in Market | 98.0% | 100.0% |
| Trades / Year | 5.8 | 60.0 | |
| Win Rate | 51.9% | 77.9% | |
RISK |
Volatility | 7.3% | 14.7% |
| Max Drawdown | -10.9% | -47.3% | |
| Sharpe Ratio | 0.7 | 0.4 | |
| Calmar Ratio | 0.4 | 0.1 | |
RESULT |
CAGR | 4.8% | 5.3% |
| Ending Capital | $23,370 | $25,443 |
Method note: Win Rate is computed per closed position using total-return P&L, including ordinary dividends where applicable. Benchmark Trades / Year reflects transaction frequency from the monthly rebalance process and is not the same object as the win-rate denominator.
What the scorecard shows
GTAA delivered a materially smoother return path, but it did not beat the benchmark on raw growth.
The core defensive result is clear in the scorecard. Volatility fell from 14.7% to 7.3%, and max drawdown improved from -47.3% to -10.9%.
That smoother path also improved risk-adjusted efficiency. GTAA posted a 0.7 Sharpe Ratio versus 0.4 for the benchmark and a 0.4 Calmar Ratio versus 0.1. It earned less raw return, but it used volatility and drawdown more efficiently than the fully invested benchmark.
The cost of that defense was lower long-run growth. CAGR was 4.8% for GTAA versus 5.3% for the benchmark, and ending capital finished at $23,370 versus $25,443. The benchmark stayed fully exposed to the five-ETF risk basket, so it captured more of the long bull-market advance.
The activity metrics explain how the two paths were produced, but they are not the main economic result. GTAA was invested 98.0% of the time and traded 5.8 times per year. The benchmark stayed fully invested and generated 60.0 transactions per year through its monthly rebalance process. Win Rate is secondary here.
Equity curve
The chart below shows the same comparison in path form rather than scorecard form. The benchmark finishes with the higher endpoint, but GTAA holds a smoother line through the major drawdown regimes that matter most for this strategy.
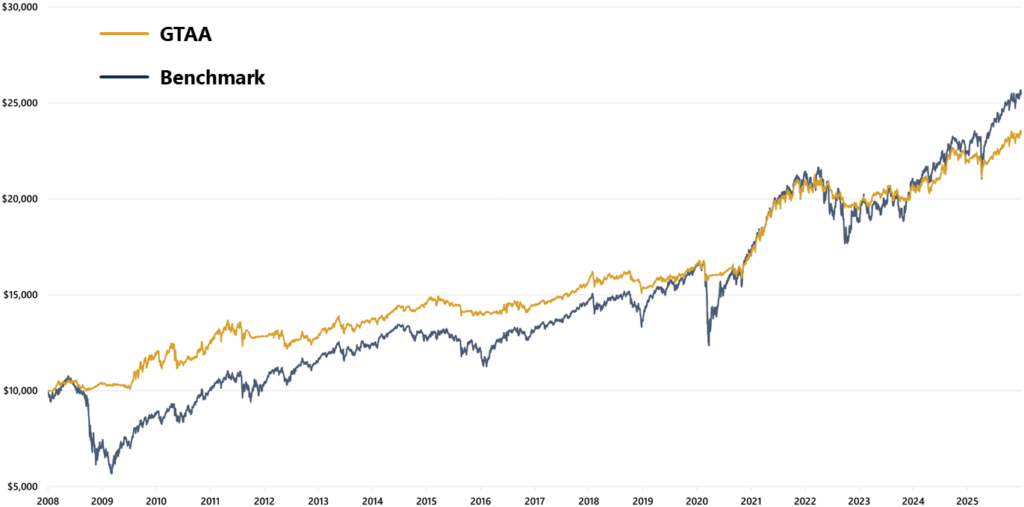
What the equity curve shows
The equity curve shows the same tradeoff as the scorecard, but in a more intuitive form. Early-year moves look visually smaller after compounding than later-year moves. Even so, the message is clear: GTAA does not try to win every rally. Its job is to change the path. Over the full test, the benchmark compounds along a steeper long-run line, while GTAA follows a smoother path with shallower drawdowns and smaller swings.
The clearest separation appears in major risk-off regimes. When the diversified risk basket breaks down, GTAA can shift out-of-signal sleeves into SHY and limit portfolio damage. That is why the strategy’s curve tends to hold up best when the benchmark is falling hardest. The benchmark experienced a much deeper maximum drawdown, while GTAA gave up far less capital at its worst point.
The cost shows up in the opposite environment. When markets rebound quickly or stay persistently risk-on, the benchmark re-accelerates faster because it stays fully exposed to the five-ETF basket at all times. GTAA often re-enters after the trend has already turned, so some upside is surrendered by design. That is not a flaw in the chart. It is the price of the strategy’s defensive rule set.
The most important thing the chart shows is that this is a different path, not just a different endpoint. GTAA is built to reduce left-tail damage and smooth the ride, not to dominate every expansionary phase. The benchmark earns more from uninterrupted exposure. GTAA earns its place by making the drawdown and volatility profile materially easier to live with.
Failure modes and tradeoffs
GTAA improves the path, but it does not eliminate cost. Its main failure mode is not catastrophic loss. It is giving up too much upside when the market turns higher quickly or stays persistently risk-on. Because the strategy responds to trend rather than anticipating it, re-entry often happens after part of the rebound has already occurred.
That creates a second tradeoff: GTAA can look late when leadership returns abruptly after a drawdown. The benchmark stays fully exposed to the five-ETF risk basket at all times, so it can recover faster in sharp rebound phases. GTAA is built to avoid deeper breakdowns, not to capture the first move off every low.
The strategy can also pay a whipsaw tax in choppy environments. When sleeves move around the trend threshold without establishing a durable direction, GTAA can rotate defensively and then rotate back without gaining much from either move. In those periods, the benchmark’s simplicity can become an advantage because it is not reacting to short-lived state changes.
Another important limitation is that GTAA is not a maximum-growth system. The benchmark can finish ahead over long stretches when uninterrupted exposure matters more than defense. That does not mean the strategy failed mechanically. It means the opportunity cost of defense exceeded the protection benefit in that stretch.
So the tradeoff is straightforward. GTAA buys smaller drawdowns, lower volatility, and a smoother ride. It pays for those benefits with delayed re-entry, occasional whipsaw drag, and lower participation during strong sustained advances. That is not a side effect of the design. It is the design.
Benefit, cost, and role
GTAA is not the higher-growth version of the benchmark. It is the lower-drawdown, lower-volatility version of the same investment problem.
The benefit of GTAA is straightforward: it aims to make the return path easier to live with. Relative to the benchmark, it reduces drawdown depth, lowers volatility, and produces a smoother equity curve. For an investor who values path control as much as endpoint growth, that is a meaningful improvement.
The cost is just as clear. GTAA does not stay fully exposed to the five-ETF risk basket at all times, so it gives up some upside when markets recover quickly or remain persistently favorable. That tradeoff shows up in lower long-run growth and lower ending wealth than the benchmark over this test.
Its role, then, is not to replace the idea of owning diversified risk assets. Its role is to apply a rules-based defensive overlay to that same opportunity set. In BTS terms, GTAA is best understood as a path-shaping allocation strategy: one designed to reduce left-tail damage and smooth the ride, even when that means accepting slower re-acceleration and some lost upside in stronger markets.
Credit: Mebane T. Faber (A Quantitative Approach to Tactical Asset Allocation)