Golden Cross & Death Cross, Backtest Video
The Golden Cross isn’t about predicting bottoms. It’s a governance rule that stays invested through sustained uptrends, steps aside after trend breaks, and forces a clean trade-off: drawdown control when trends fail, paid for with lag in rebounds and whipsaw in chop.
It is a slow, confirmation-based rule that flips between two states: fully invested in SPY during uptrends, and 100% in cash when the trend filter breaks.
That simplicity is the point. The strategy makes a small number of big exposure decisions. The question is not whether it “predicts” anything. The question is what it does to the path of returns when markets stop rewarding passive equity exposure.
This episode walks the evidence, then traces the equity curves through real regimes so you can see exactly when the protection shows up, when it fails to help, and the specific regimes where you pay for it.
Why the Golden Cross and Death Cross get attention
The Golden Cross gets attention because it turns a fuzzy idea into a binary rule: stay fully exposed when the 50-day moving average is above the 200-day moving average, step aside when it falls below. It is one of the few signals that is both widely recognized and easy to backtest, which is why it keeps resurfacing in market commentary.
The more useful way to think about it is not as a bullish omen, but as governance. A slow crossover overlay is designed to be late by construction. It will not catch bottoms, it will not exit tops, and it will whipsaw when markets chop.
What it can do, when the market gives it the right environment, is reduce the depth and duration of the worst drawdowns by stepping aside during prolonged breaks. That is why this strategy remains relevant: it is a lever on exposure and drawdown, not a promise of precision.
What the video delivers
- The full strategy spec. Every input, condition, and decision rule is stated explicitly.
- Signal and execution timing. Signal evaluation and trade execution are specified so the backtest is reproducible.
- Implementation-grade clarity. Definitions and rules are stated explicitly to reduce ambiguity.
- A transparent benchmark. The benchmark is run under the same assumptions for a clean comparison.
- On-screen backtest settings. Timeframe, costs, cash treatment, and exclusions are stated in the video.
- A head-to-head scorecard with a fixed order. Exposure first, risk second, payoff last.
- An equity-curve walkthrough that matches the scorecard. Narration ties the numbers to what actually happened across the backtest window.
- Regime-aware interpretation. The episode pressure-tests strategy behavior through distinct market conditions.
- Frictions treated as real. Time in market, trades per year, and costs are stated so you can judge whether it clears your trading constraints.
- A structured conclusion. Summarized as Benefit, Cost, Role so you can evaluate it quickly and consistently.
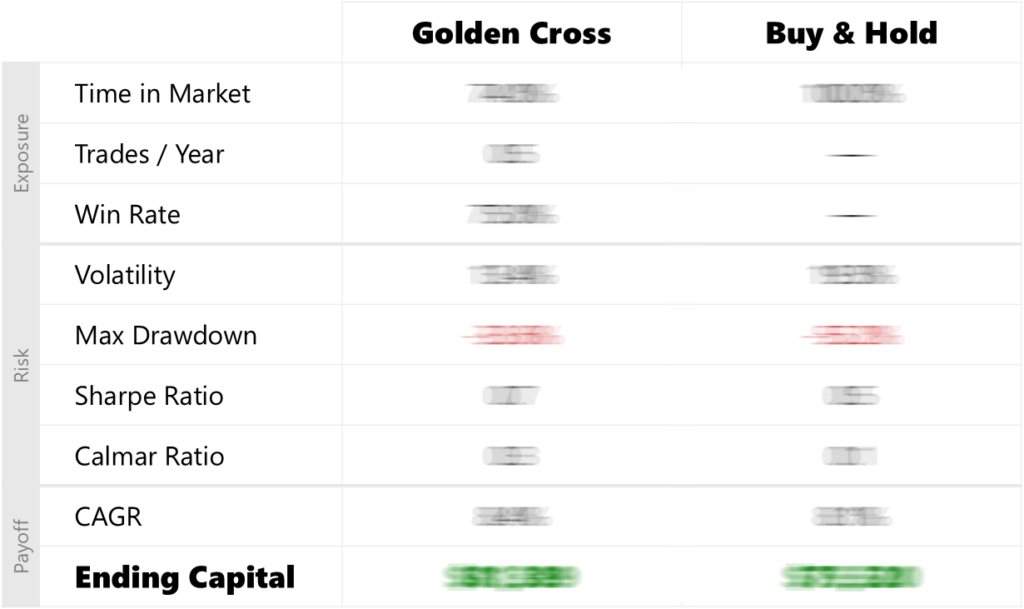
Head-to-head scorecard
Watch the video to see the full head-to-head scorecard unblurred. The values are blurred here on purpose because the scorecard is not meant to be skimmed in isolation. In the episode, we reveal it in a fixed order and tie the numbers to the equity curve so you can see exactly what drove each line.
Trading rules
This strategy is defined by a single state variable, whether SMA(50) is above or below SMA(200). Entries and exits trigger only on crossover events, using a strict yesterday-versus-today event definition. Let “t” denote the signal bar. Signals are evaluated at Close(t); trades execute at Open(t+1).
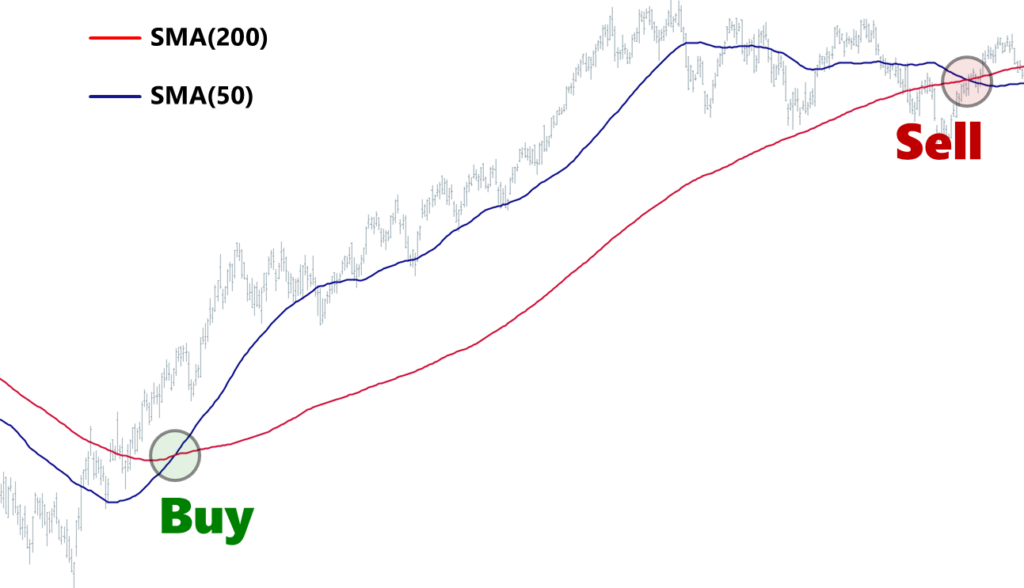
Chart labels, indicators and trading logic
Markers identify the bar where the event occurs. They are not plotted at the exact fill price.
- Red line indicates the 200-day simple moving average of Close, SMA(200).
- Blue line indicates the 50-day simple moving average of Close, SMA(50).
- Green Buy marker indicates the entry signal bar at Close(t).
- Red Sell marker indicates the exit signal bar at Close(t).
Entry
At Close(t), if SMA(50) is above SMA(200) and SMA(50) was at or below SMA(200) on the prior bar, signal a buy on that bar and execute the trade at Open(t+1).
Exit
At Close(t), if SMA(50) is below SMA(200) and SMA(50) was at or above SMA(200) on the prior bar, signal a sell on that bar and execute the trade at Open(t+1).
Stay updated
Subscribe to Backtested Strategies to get alerts when new backtest videos and research articles are published.