Connors RSI(2) Mean Reversion, Backtest Video
Connors RSI(2) isn’t about “buying oversold.” It’s about whether a rules-based pullback entry can harvest fast snapbacks inside an uptrend without bleeding when weakness persists.
This Larry Connors RSI(2) trading strategy is an intentionally fast mean-reversion trigger. It waits for a short, sharp pullback while the longer-term trend is intact, buys into that stress, then exits on a mechanical rebound. The idea is simple enough to sound obvious, which is exactly why it needs a hard backtest.
The hard part is the trade-off. A dip-buyer can look brilliant when bounces are frequent and fast, and it can look fragile when oversold stays oversold, volatility clusters, and exits and re-entries start to churn. This episode is built to make that behavior visible, regime by regime, on the equity curve.
This video runs the Connors RSI(2) full rule stack on SPY under explicit timing and assumptions, then reads the evidence in a fixed order: participation and trading behavior first, risk path next, payoff last. You will see what the strategy is doing most of the time, when it is getting paid for it, and when it is simply not working.
Why Connors RSI(2) gets attention
Connors RSI(2) sits near the center of systematic “buy the dip” research because it compresses the whole idea into a compact, testable rule set. Connors RSI(2) uses a two-period RSI trigger, which reaches extremes quickly. It pairs a long-term regime gate with a short-term pullback filter and an ultra-short oscillator that reaches extremes quickly. That makes it easy to implement and benchmark, and hard to evaluate honestly without looking at the full trade distribution and exposure profile.
It also targets a real behavioral pattern in index markets: during uptrends, selloffs often overshoot on the downside, then mean-revert as buyers step back in. RSI(2) is designed to be reactive, treating those air pockets as a repeatable entry condition instead of a discretionary judgment call.
The failure modes are just as clear as the appeal. When the market is trending down, when rebounds are delayed, or when volatility stays elevated, mean reversion stops behaving like a gentle bounce and starts behaving like repeated catching of falling knives. That combination, intuitive logic plus obvious regime risk, is why Connors RSI(2) keeps resurfacing and why this episode focuses on how it behaves, not how it is marketed.
What the video delivers
- The full strategy spec. Every input, condition, and decision rule is stated explicitly.
- Signal and execution timing. Signal evaluation and trade execution are specified so the backtest is reproducible.
- Implementation-grade clarity. Definitions and rules are stated explicitly to reduce ambiguity.
- A transparent benchmark. The benchmark is run under the same assumptions for a clean comparison.
- On-screen backtest settings. Timeframe, costs, cash treatment, and exclusions are stated in the video.
- A head-to-head scorecard with a fixed order. Exposure first, risk second, payoff last.
- An equity-curve walkthrough that matches the scorecard. Narration ties the numbers to what actually happened across the backtest window.
- Regime-aware interpretation. The episode pressure-tests strategy behavior through distinct market conditions.
- Frictions treated as real. Time in market, trades per year, and costs are stated so you can judge whether it clears your trading constraints.
- A structured conclusion. Summarized as Benefit, Cost, Role so you can evaluate it quickly and consistently.
Head-to-head scorecard
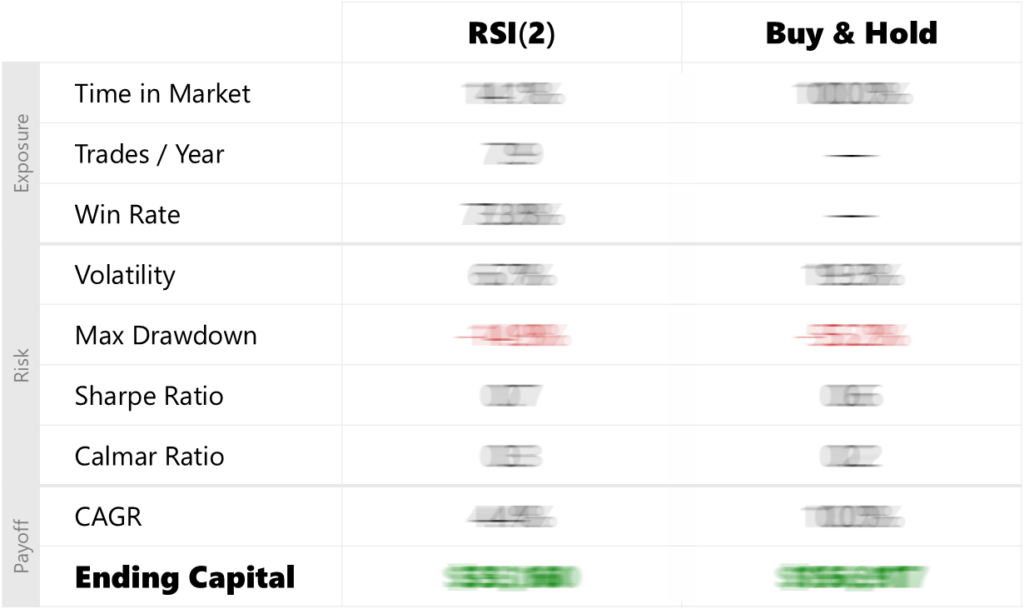
Watch the video to see the full head-to-head scorecard unblurred. The values are blurred here on purpose because the scorecard is not meant to be skimmed in isolation. In the episode, we reveal it in a fixed order and tie the numbers to the equity curve so you can see exactly what drove each line.
Trading rules
This strategy combines a 200-day regime gate with a 5-day pullback filter and a 2-period RSI oversold trigger, then exits on a mechanical rebound. Let “t” denote the signal bar. Signals are evaluated at Close(t); trades execute at Open(t+1).
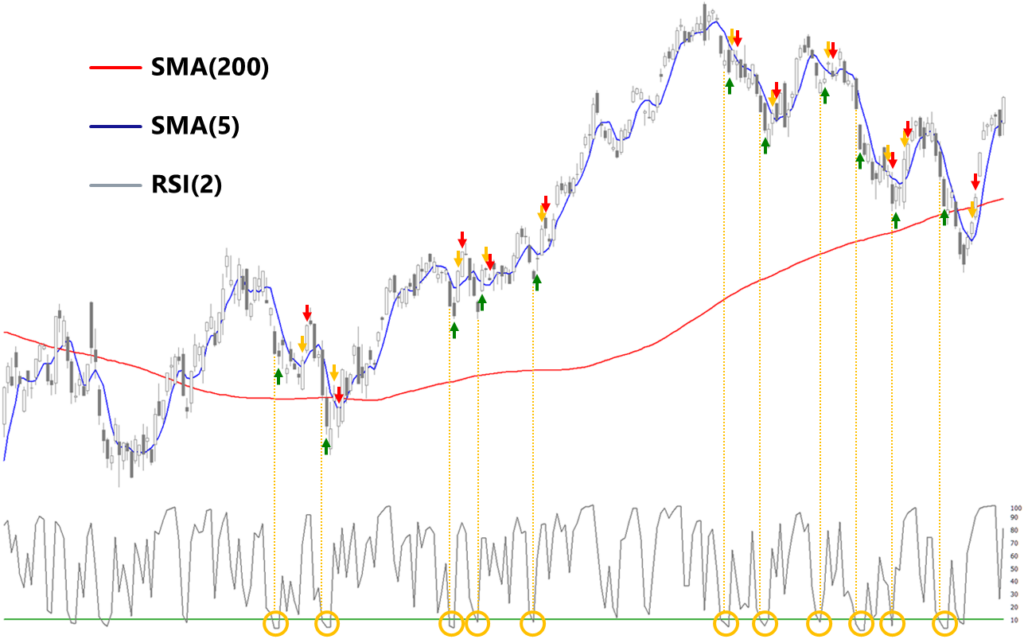
Chart labels, indicators and trading logic
Markers identify the bar where the event occurs. They are not plotted at the exact fill price.
- Red line indicates the 200-day simple moving average of Close, SMA(200)
- Blue line indicates the 5-day simple moving average of Close, SMA(5)
- Grey line indicates Wilder RSI, length 2, on Close, RSI(2)
- Green horizontal line indicates the RSI(2) threshold at 10
- Yellow circles indicate the entry conditions are met on the entry signal bar at Close(t)
- Yellow vertical lines indicate entry signal bars at Close(t)
- Green up arrows indicate entry execution bars at Open(t+1)
- Yellow down arrows indicate exit signal bars at Close(t)
- Red down arrows indicate exit execution bars at Open(t+1)
Entry
At Close(t), if Close is above SMA(200), Close is below SMA(5), and RSI(2) is below 10, signal a buy on that bar and execute the trade at Open(t+1).
Exit
At Close(t), if Close is above SMA(5), signal a sell on that bar and execute the trade at Open(t+1).
Stay updated
Subscribe to Backtested Strategies to get alerts when new backtest videos and research articles are published.
Video transcript
Today, we’re backtesting Connors RSI(2). This mean-reversion trading strategy patiently waits for sharp pullbacks within a long-term uptrend, then buys the dip and exits on a quick bounce. We’ll compare it to simply buying and holding the S&P 500 from 1996 through 2024. This is Backtested Strategies. Real tests. Hard data. No spin.
If you want to see how trading strategies behave in rigorous backtests using professional tools and data, you’re in the right place. Connors RSI(2) trading rules. For this backtest we’re using daily bars on SPY from a professional data provider with prices adjusted for splits, dividends and other capital actions. This trading strategy uses three indicators. First: a 200-day simple moving average, or SMA. That’s our long-term trend anchor. Second: a 5-day SMA, which we use as a shorter-term trend filter. And third: a 2-period relative strength index, or RSI for short, with an oversold line at 10.
A buy signal occurs when three things line up: Price is above the 200-day SMA, below the 5-day SMA, and RSI(2) is less than 10. That flags a short, sharp sell-off within a longer-term uptrend. When all three of these conditions are true, and there’s no open position, the system buys SPY at the next bar’s open with 100% of available equity. A sell signal occurs when price closes back up above its 5-day SMA. At that point, it sells the entire position at the next bar’s open and moves to cash.
So, the idea is straightforward: as equities drift higher during uptrends, they often overshoot to the downside during corrections along the way. This strategy attempts to turn those corrections into a systematic short-term, mean-reversion trading system.
Each strategy starts with $10,000 of capital. The evaluation window runs from the start of 1996 through the end of 2024 using whole calendar years. That’s nearly three decades of data, spanning multiple bear markets, many powerful bull runs, and some sharp volatility shocks along the way. Signals are evaluated using the closing price, and all trades execute at the next day’s open, so there’s no look ahead. Every trade pays 1 basis point per side in costs: 1 to buy and 1 to sell. When the system is in cash, cash earns 0%. We do not model taxes, platform fees, advisory fees or financing costs. And our benchmark is straightforward. We buy SPY once and just hold it through the end of the test using the same backtest settings. So, does the Connors RSI(2) trading strategy meaningfully improve results versus our Buy & Hold benchmark? Let’s dive into the numbers.
All right, let’s have a look at the scorecard and walk through the head-to-head performance metrics. We’ll go section by section in the same order you see on screen. Section 1: Exposure. For Connors RSI(2), time in the market is 14.1%. That works out to 7.9 trades per year, and the win rate is 73.8%. For Buy & Hold, time in the market is by definition 100%. Trades per year and win rate are not meaningful because the position is held continuously.
Section 2: Risk. For Connors RSI(2), volatility is 6.7% with a max drawdown of -14.9%. The Sharpe and Calmar ratios are 0.7 and 0.3, respectively. For Buy & Hold, volatility is 19.3% with a max drawdown of -55.2%, and the Sharpe and Calmar ratios are 0.6 and 0.2.
Section 3: Payoff. For Connors RSI(2), the compound annual growth rate is 4.4% and ending capital is $35,160. For Buy & Hold, the growth rate is 10% and ending capital is $156,917. So, Connors RSI(2) behaves more like a low-risk, part-time dip-buying system than a full replacement for owning the index.
Now that you’ve seen the scorecard, let’s look at how those results show up over time on the equity curve. The gold line is Connors RSI(2), and the dark line is our Buy & Hold benchmark. Here’s the key visual to watch. When the gold line is rising, the strategy is invested. When the gold line goes flat, the strategy is in cash, waiting for the next pullback signal. From 1996 through the late 90s, both lines move up with the bull market, but the dark Buy & Hold line climbs faster and ends higher while the gold Connors RSI(2) line rises more slowly, in smaller steps.
In the 2000s, through the dot-com bust and the global financial crisis, the contrast flips. The Buy & Hold benchmark line collapses, spikes and collapses again, carving out deep valleys. In contrast, the Connors RSI(2) line spends most of that decade flat or gently stepping higher, with much smaller dips along the way. By the end of 2009, the two lines are nearly on top of each other again. But the path to get there was quite different. From 2010 through 2019, you see the opportunity cost of being in cash most of the time. The Buy & Hold line bends into a classic compounding curve while the Connors RSI(2) line is almost flat by comparison, with long horizontal stretches.
And in 2020 through 2024, that same pattern plays out again at higher speed. During the COVID crash, Buy & Hold drops sharply while Connors RSI(2) barely dips. But as the market snaps back and pushes to new highs, Buy & Hold races away and Connors RSI(2) continues its slow, controlled climb. Taken together, the equity curve makes the trade-off easy to see. Connors RSI(2) gives you a calmer path with long periods on the sidelines, but by the end of the sample, it finishes far below Buy & Hold.
To recap, we’ve reviewed the head-to-head metrics on the scorecard and we’ve walked the equity curve, highlighting how this trading strategy behaves over time. Now, let’s take a step back and talk about what it can do for you in terms of benefit, cost and what role, if any, this strategy could play in a portfolio.
The main benefit is path control. Connors RSI(2) is one-third the volatility of our Buy & Hold benchmark, with max drawdown in the mid-teens instead of the mid-50s, and it spends over 85.0% of the sample in cash. On the equity curve that shows up as a slow, steady line with shallow dips, especially in the multi-crash decade from 2000 through 2009, where it ends up in nearly the same place as Buy & Hold but gets there with far less trauma. If your primary pain point is large, multi-year drawdowns, this kind of RSI mean-reversion system can make the ride much easier to live with, without introducing short selling or leverage.
The cost shows up at the finish line. Because the strategy is only in the market 14.1% of the time and targets small, short-term bounces, the long-run return is far below simply owning SPY. On the full period scorecard, Buy & Hold compounds more than twice as fast and ends with much more capital. On the equity curve, you see that gap open up during the long post-crisis bull market and again after COVID. Each time Connors RSI(2) steps aside during a pullback, then re-enters after part of the rebound, more of the long-run upside migrates to the benchmark.
Given all of that, what role is Connors RSI(2) best suited for in a portfolio? It makes sense if your goal is to add a controlled, rules-based way to buy sharp pullbacks in an index you already own, with tight, trade-level risk and shallow drawdowns, and you accept that the price of that comfort is a much lower terminal wealth number than Buy & Hold. However, if your objective is to maximize long-run index-level growth and you can tolerate deep drawdowns, simple Buy & Hold remains the cleaner benchmark as long as you remember that these conclusions are based on this single-asset SPY backtest.