The January Barometer says risk-on. The January Confirmation Indicator says risk-off. Now what?
Split signal in January 2026:
The January Barometer is risk-on, but the January Confirmation Indicator is risk-off.
In the last three completed cases of this split (2011, 2018, 2024), VIX later reached 48 or higher.
The January Confirmation Indicator (JCI) extends the January Barometer by adding breadth, volatility, and intra-month confirmation. It keeps the one-decision-per-year simplicity, but adds three checks: broad participation, volatility-regime conditioning, and intra-month confirmation.
In January 2026, the January Barometer signaled risk-on, but JCI printed risk-off. It was 0-of-3 confirmed: none of the three January windows were up (end ≤ start in all three).
Historically, 0-of-3 is rare. In the completed 1994–2025 history, it occurred once, in 2020.
The January Barometer is risk-on because the $SPX January month-end close is above the prior December month-end close. JCI is risk-off because the $RUA/$VIX confirmation ratio weakened as volatility rose.
All three $RUA/$VIX windows were down:
- Full January: -13.0%
- First five trading days: -5.0%
- Last five trading days: -7.8%
This was not limited to a single month-end print. It failed early and late. That’s exactly what the intra-month confirmation logic is designed to detect.
January 2026 is noteworthy because the signals point in opposite directions. JCI is also delivering its most stringent risk-off diagnostic reading (0-of-3 confirmed). Rather than ‘picking a side’ reflexively, one way to use the split is as a regime-risk flag for annual risk budgeting.
Now what?
Consider treating this as a regime-risk flag, not a point forecast. Risk-off here means a more defensive annual posture, not a call on next week.
- If you run JCI as the annual posture rule, 2026 is risk-off (0-of-3 confirmed).
- This is the fourth time the January Barometer is risk-on while JCI is risk-off; only the first three have full-year outcomes (2011, 2018, 2024).
- If you follow the January Barometer, treat this split as a caution flag: JCI is flagging deterioration once volatility enters the frame.
- If you use both, the practical response is usually risk budgeting (lower gross, less leverage, tighter hedging rules) rather than a binary “pick a side.”
What the JCI measures
Mechanically, it applies a $RUA month-end breadth gate, then evaluates confirmation on the $RUA/$VIX ratio across three windows: full month, first five trading days, last five trading days. The objective is not point forecasting; it is an improved error profile, especially fewer “risk-on” calls into down years.
The intuition is straightforward: a “good” January should look like broad-market strength that is not being offset by a rising-volatility backdrop. If volatility is rising enough to overwhelm broad equities, that matters, even if large caps finish the month up.
What happens when the January Barometer and JCI disagree?
Disagreements between the January Barometer and JCI are rare, so we treat them as case studies. Across 1994–2025 (32 signal years), the two indicators disagreed five times under the JCI rules used on this page. These cases illustrate what JCI adds beyond a month-end S&P 500 close: breadth confirmation, volatility-regime conditioning, and intra-month confirmation.
The highest-stakes case is January Barometer risk-on while JCI is risk-off. This occurred three times: 2011, 2018, and 2024. Using the official $VIX series, the calendar-year max daily High was 48.0 (2011), 50.3 (2018), and 65.7 (2024). In these three instances (n=3), the subsequent year’s VIX highs were elevated; treat this as descriptive rather than statistically validated.
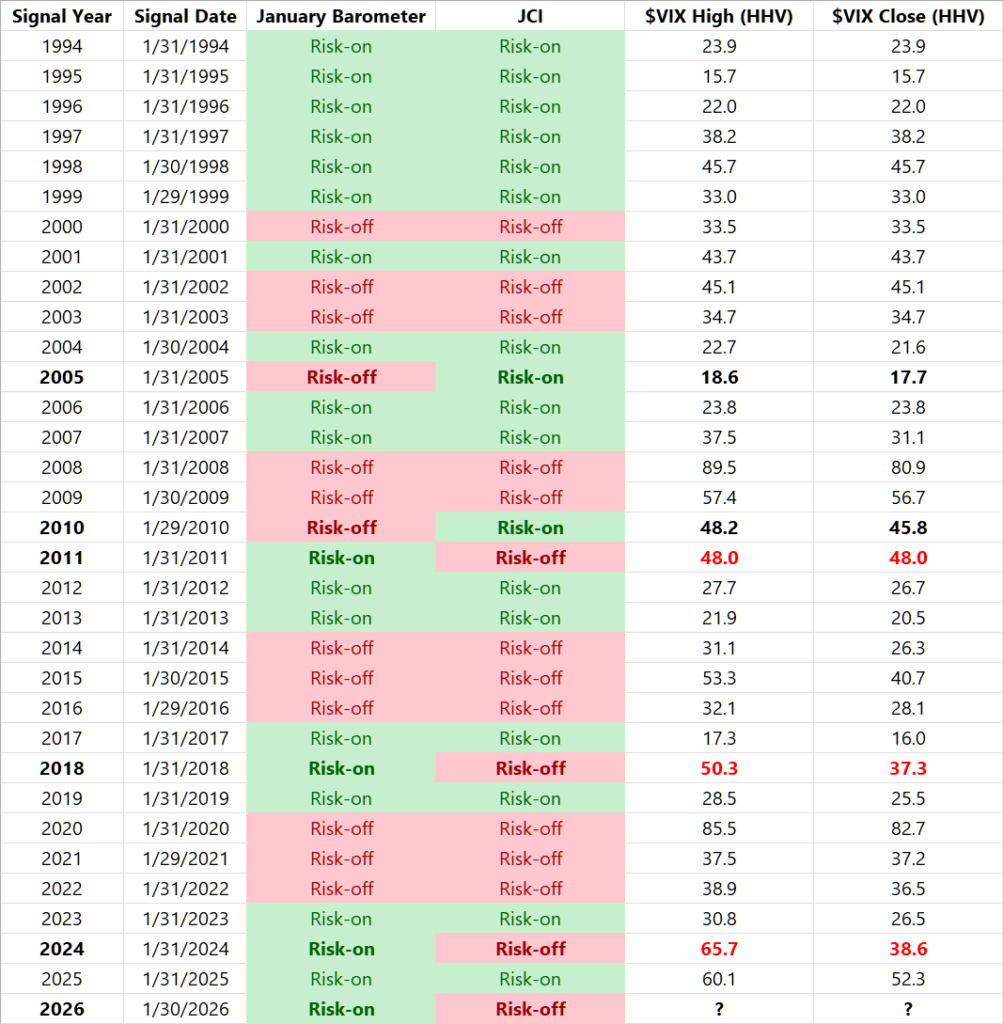
January Barometer and January Confirmation Indicator signals, 1994–2026. Historical counts above use 1994–2025 (completed years); 2026 is shown for current status.
JCI Rules
Short version below. The full definition and historical tables are on the JCI overview page.
- The JCI is computed from daily closes using the ratio $RUA/$VIX.
- Breadth gate: $RUA January month-end close > prior December month-end close.
- Three $RUA/$VIX windows (up if end > start): full January (Dec month-end → Jan month-end), first five trading days (Jan day 1 → day 5), last five trading days (Jan day N−4 → day N).
- If breadth gate is positive: risk-on if ≥2 of 3 windows are up; otherwise risk-off.
- If breadth gate is not positive: risk-on only if both the first five and last five windows are up; otherwise risk-off.
- Optional diagnostic: “0-of-3 confirmed” means none of the three windows are up (end ≤ start in all three).
For the full 2005–2025 results table, see the January Confirmation Indicator overview page.