Connors RSI(2) Mean Reversion on SPY — Backtest Video
Connors RSI(2) isn’t about “buying oversold.” It’s about enforcing a disciplined pullback entry inside a defined regime, then seeing whether that rule stack earns its keep when rebounds are fast, slow, or absent.
Connors RSI(2) is a deliberately fast mean-reversion trigger. It’s built to react to short, sharp pullbacks, not to map broad overbought and oversold cycles the way RSI(14) is typically used. It looks almost too clean on paper. Define an uptrend, wait for a sharp pullback, buy when the tape looks stressed, and exit on a mechanical rebound. The catch is that “simple” isn’t the same as “robust,” especially once you account for exposure, trade frequency, and what happens when oversold stays oversold.
This video backtests the full rule stack on SPY with explicit timing and assumptions, then reads the scorecard the right way. Participation and trading behavior come first, risk path next, and payoff last, so you can see whether the strategy’s logic shows up in the data without giving the ending away up front.
Why Connors RSI(2) gets attention
Connors RSI(2) sits near the center of “buy the dip” research because it reduces the idea to a compact, testable rule set. It combines a very short-horizon oversold trigger with simple context filters, which makes it easy to implement and easy to benchmark. That accessibility is exactly why it has persisted: anyone can run it, argue about it, and iterate on it.
It also attracts attention because it targets a recurring feature of equity index behavior: sharp pullbacks that occur inside broader uptrends. A fast oscillator like RSI(2) is designed to push into extremes quickly during these events, which creates frequent, highly time-localized entry opportunities. In principle, that can turn “market stress” into a repeatable entry condition rather than a discretionary call.
The skepticism is just as durable as the popularity. Mean reversion looks best when rebounds happen quickly. The strategy gets its real test in the regimes where that assumption is least reliable: persistent selloffs, volatility clusters, and choppy recoveries where exits and re-entries can churn. That combination—intuitive logic, easy implementation, and clear failure modes—is what makes Connors RSI(2) a perennial candidate for serious backtesting.
What the video delivers
- The full strategy spec. Every input, condition, and decision rule is stated explicitly.
- A complete timing model. Signal timing and execution timing are specified so the backtest is reproducible.
- Implementation-grade clarity. Definitions, rules, and edge cases are spelled out to prevent ambiguity.
- A transparent benchmark. The benchmark is run under the same assumptions for a clean comparison.
- On-screen backtest assumptions. Timeframe, costs, cash treatment, and exclusions are stated in the video.
- A head-to-head scorecard with a fixed order. Exposure first, risk second, payoff last.
- An equity-curve walkthrough that matches the scorecard. Narration ties the numbers to what actually happened across the backtest window.
- Regime-aware interpretation. The episode pressure-tests strategy behavior through distinct market conditions.
- Frictions treated as real. Turnover and implementation implications are discussed as constraints, not footnotes.
- A structured conclusion. The takeaway is framed as a Benefit, Cost, Role portfolio decision, not a headline.
Head-to-head scorecard

Watch the Connors RSI(2) vs Buy & Hold backtest video >>
Trading rules
This strategy combines a 200-day regime gate with a 5-day pullback filter and a 2-period RSI oversold trigger, then exits on a mechanical rebound. Signals are evaluated on the close; trades execute at the next bar’s open.
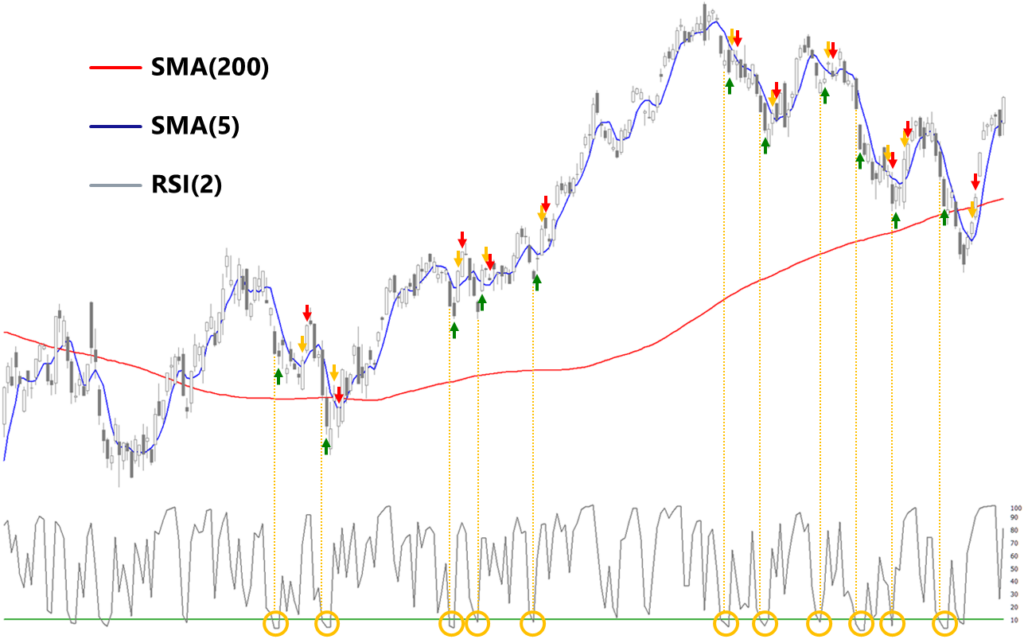
Chart labels, indicators and trading logic
Markers identify the bar where the event occurs. They are not plotted at the exact fill price.
- Red line indicates the 200-day simple moving average of Close, SMA(200)
- Blue line indicates the 5-day simple moving average of Close, SMA(5)
- Grey line indicates Wilder RSI, length 2, on Close, RSI(2)
- Green horizontal line indicates the RSI(2) threshold at 10
- Yellow circles indicate the entry conditions are met on the entry signal bar at Close t
- Yellow vertical lines indicate entry signal bars at Close t
- Green up arrows indicate entry execution bars at Open t+1
- Yellow down arrows indicate exit signal bars at Close t
- Red down arrows indicate exit execution bars at Open t+1
Entry
At Close t, if Close is above SMA(200), Close is below SMA(5), and RSI(2) is below 10, signal a buy on that bar and execute the trade at Open t+1.
Exit
At Close t, if Close is above SMA(5), signal a sell on that bar and execute the trade at Open t+1.
Connors RSI(2) Mean Reversion on SPY — FAQ
Who is this Connors RSI(2) mean reversion backtest for?
Systematic traders and serious investors who want a rules-first, assumption-explicit backtest of the Connors RSI(2) mean reversion strategy on SPY, not a highlight reel. It’s aimed at people who care about what the full backtest says about win rate, drawdowns, turnover, and the trade-off versus Buy & Hold, under clearly stated rules and costs.
What is the Connors RSI(2) trading strategy on SPY, in plain English?
It’s a rules-based “buy the dip” system on SPY that combines a long-term regime gate with a 2-period RSI oversold trigger and a mechanical rebound exit. The idea is to only buy short, sharp pullbacks inside an uptrend, then get out on a defined bounce, instead of using RSI(14) as a slow, discretionary overbought/oversold gauge.
Does the Connors RSI(2) mean reversion strategy still work on SPY vs Buy & Hold in your backtest?
That’s the core question the episode answers. The video runs a full SPY backtest under explicit timing and cost assumptions and compares Connors RSI(2) head-to-head with Buy & Hold on participation, trade frequency, volatility, max drawdown, and payoff. You see where the performance difference actually comes from on the equity curve, not just in a single summary number.
Why use a 2-period RSI instead of the classic 14-period RSI?
RSI(2) is intentionally ultra-short and reactive, built to flag very short-term oversold conditions that may snap back quickly. RSI(14) is slower and more about medium-term momentum and context. The episode treats Connors RSI(2) as a short-horizon mean reversion engine wrapped inside a trend filter, and contrasts that logic with how traders typically use longer-period RSI.
How sensitive are the results to the RSI(2) oversold threshold and filters?
Mean reversion systems are often highly sensitive to threshold choices and context filters, and Connors RSI(2) is no exception. The episode includes a tuned-threshold variant and uses the scorecard plus equity curve to show how changing only the RSI(2) level and related conditions can shift win rate, trade count, and overall risk/return behavior.
Does the video include the exact rules and backtest settings?
Yes. The episode states every trading rule, timing assumption, and benchmark setup on-screen, and then shows a tuned Connors RSI(2) variant at the end.