BTS Strength Zones — S&P-100 Stocks Backtest Results
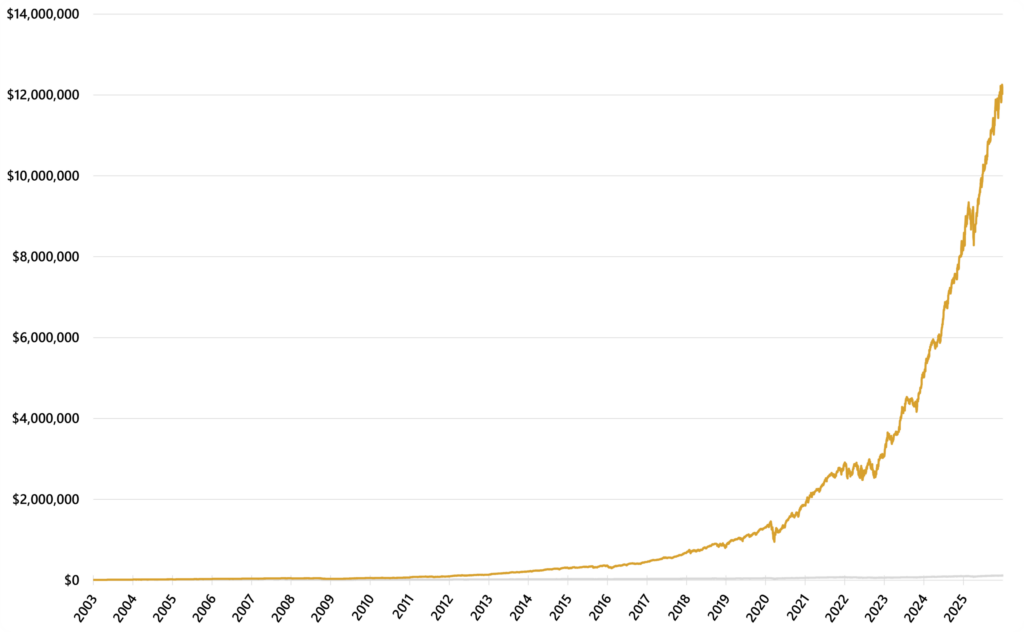
Backtested Strategies has published BTS Strength Zones — S&P-100 Stocks Backtest, a new report on a long-only tactical allocation model applied to a fixed universe of current S&P-100 stocks. Over the 2003–2025 whole-calendar-year report window, the complete modeled BTS Strength Zones portfolio produced 36.1% CAGR versus 11.3% for buy-and-hold SPY. Over that 23-year period, a $10,000 starting value grew to $12,026,423 for the strategy and $116,729 for SPY. Maximum drawdown was -35.7% versus -55.2% for SPY, while volatility was slightly higher at 19.1% versus 18.7%.
BTS Strength Zones — S&P-100 Stocks Backtest applies the same strategy rules used across the BTS Zones series and the same governing BTS Strength Zone formulas and rules used across all BTS Heatmaps. That common design supports direct comparison with other BTS Zones backtests without changing the governing strategy rules or heatmap formulas.
Results
The chart shows a widening long-term performance gap punctuated by the 2008 crisis and later setbacks. The strategy finished far ahead of SPY while recovering from its worst loss much sooner, but the path still included deep drawdowns.

Time in Market was 99.6%, indicating near-continuous equity exposure rather than a defensive cash posture, while volatility was slightly higher at 19.1% versus 18.7% for SPY.
The drawdown profile was materially better than the benchmark’s but still demanding. Maximum drawdown reached -35.7%, versus -55.2% for SPY. The strategy recovered its financial-crisis peak by November 9, 2009, after 451 calendar days underwater; SPY did not recover its prior peak until August 16, 2012, after 1,773 days. The evidence supports a shallower catastrophic loss and faster recovery, not an absence of deep or extended losses.
The return advantage appeared in both SPY up years and the selected SPY down years. In SPY up years, BTS Strength Zones produced 42.5% filtered CAGR versus 17.1% for SPY. Across the three SPY down years—2008, 2018, and 2022—the strategy produced 0.3% filtered CAGR versus -21.0% for SPY. The strategy still experienced a -35.7% worst within-year drawdown in those selected down years.
The full-period result was not driven by a single endpoint. BTS Strength Zones beat SPY on CAGR and Sharpe ratio in all 241 rolling three-year windows and all 217 rolling five-year windows. Lower volatility appeared in 20.3% of three-year windows and 29.0% of five-year windows, while smaller maximum drawdowns appeared in 59.3% and 56.2%, respectively. The evidence supports broad historical return and risk-adjusted-return leadership, not a consistently smoother daily path.
Methodology
The model applies published BTS Strength Zones to a fixed universe of current S&P-100 stocks. Stocks become eligible only when their true source history begins. A portfolio-level VIX 50/35 regime determines whether a stock associated with an active BTS Strength Zone may enter the portfolio. Once admitted, the stock remains held through the scheduled end of its BTS Strength Zone, and entered stocks are equal-weighted at target-decision events.
When no BTS Strength Zone is entered, the portfolio holds SPY while the regime is ON and SHY while it is OFF. Stocks without a published BTS Strength Zone receive no offensive allocation.
Reported performance reflects the full modeled portfolio, including entered stocks and SPY/SHY fallback holdings.
Backtest results follow the BTS Methodology, which sets common conventions for data and calendar alignment, execution pricing, missing-data and end-of-range handling, trading costs and spread-aware slippage, portfolio accounting, cash and dividend treatment, benchmark conventions, reporting windows, performance metric calculations, and, where reported, market-capacity screening. Strategy-specific rules, universes, eligibility, timing, sizing, and constraints are defined in each report.
Caveats
The backtest applies the same fixed set of current S&P-100 stocks throughout the 2003–2025 period. The report evaluates recurring seasonality in those specified stocks using the BTS Strength Zone framework; it is not intended to recreate the historical S&P-100 index. The results should therefore be interpreted as a seasonality study of that fixed stock set and should not be generalized to former constituents or to the historical index as a whole.
The published BTS Strength Zones were defined from historical data through 2025. The reported result is an in-sample historical analysis, not an out-of-sample validation.
Implementation burden remained high. The strategy averaged 1,051.1 modeled executions per year after excluding the terminal reporting close, and equal weighting may still produce correlated concentration across related mega-cap companies and sectors when multiple BTS Strength Zones overlap.
The regime figures are filtered-year diagnostics, not continuous-window backtest results. They support historical downside containment, not loss avoidance. Likewise, the universal rolling CAGR and Sharpe record is an unusually uniform in-sample result and reinforces the importance of the fixed-universe and model-selection cautions.
Market capacity
The market-capacity screen produced an overall GREEN status at the modeled account scale. All 24,173 requested execution events were assessable, giving 100.00% event-count and gross-notional coverage. Every usable event was classified as market capacity likely; no event reached the questionable or unlikely categories.
The most constrained event represented 0.42% of the highest daily volume observed during the prior 21 trading sessions, remaining well below the 5% questionable threshold. The result indicates that the modeled trades were small relative to the recent peak-volume record across the tested S&P-100 stock universe.
The GREEN status does not mean the strategy can be scaled without limit. The screen compares modeled shares with recent peak volume; it does not estimate typical daily liquidity, bid-ask spreads, order-book depth, market impact, intraday liquidity, auction effects, or realized slippage. It should be read as evidence that the tested account scale was compatible with the available volume record, not as a universal statement about deployable capital.
Read the report
The full BTS Strength Zones — S&P-100 Stocks Backtest report includes preview and full-period metrics, complete strategy rules and mechanics, equity-curve and drawdown-profile charts, caution flags, failure-mode analysis, market-capacity results, monthly and annual returns, SPY up-year and down-year diagnostics, rolling-window results, pseudocode, and implementation guardrails.
About Backtested Strategies
Backtested Strategies (BTS), operated by Marquantex LLC, is a financial research publisher built around the BTS Methodology, a standardized framework for testing trading strategies with stated rules, consistent assumptions, benchmark discipline, cost and slippage treatment, portfolio accounting, and clear interpretation so readers can evaluate market ideas through evidence rather than hype or unsupported claims.