
BTS Strength Zones — International Country ETFs Backtest Results
A long-only, unleveraged tactical allocation model using published BTS Strength Zones across a fixed universe of 39 country ETFs produced 24.8% CAGR versus 11.3% for buy-and-hold SPY over the 2003–2025 whole-calendar-year backtest. During the 23-year period, a $10,000 starting value grew to $1,616,487 for the strategy versus $116,729 for SPY.
Results
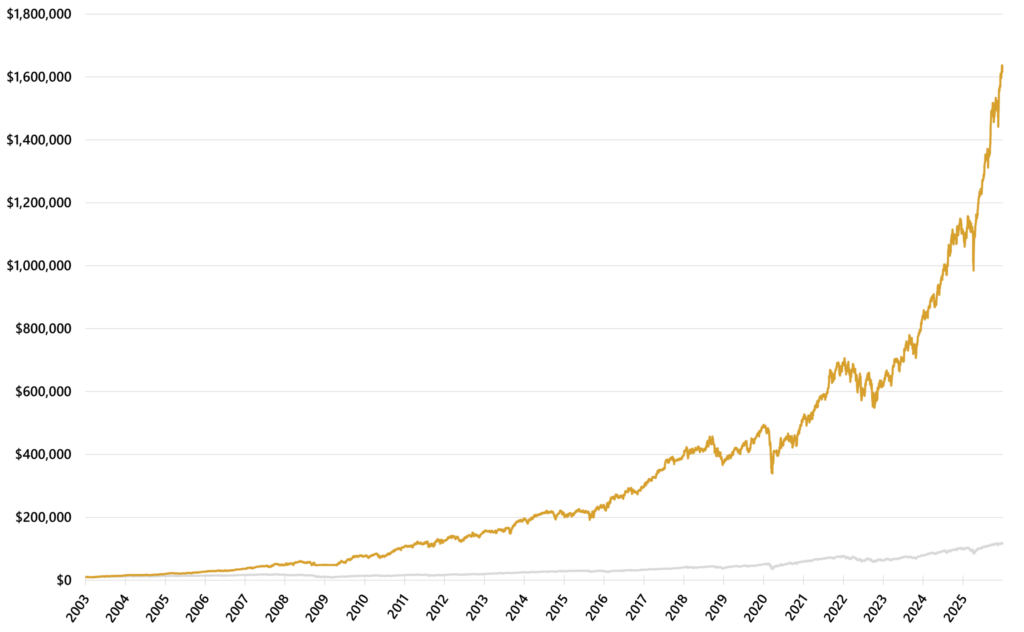
Time in Market was 98.0%, indicating near-continuous market exposure. Full-window volatility was 19.0% versus 18.7% for SPY.
Maximum drawdown was -31.3% versus -55.2% for SPY. A drawdown of more than 31% remained substantial.
In SPY up years, BTS Strength Zones produced 30.0% filtered CAGR versus 17.1% for SPY. Across the three SPY down years—2008, 2018 and 2022—the strategy produced -5.0% filtered CAGR versus -21.0% for SPY. The strategy still lost money across those selected down years.
BTS Strength Zones beat SPY on CAGR in 85.5% of rolling three-year windows and 90.3% of rolling five-year windows. The strategy’s worst rolling CAGR remained positive at 3.4% over three years and 7.3% over five years.
Methodology
The model applies published BTS Strength Zones to a fixed universe of 39 country ETFs. A portfolio-level VIX 50/35 regime controls entry. Entered ETFs are equal-weighted at target-decision events and held through the scheduled end of each BTS Strength Zone. When no BTS Strength Zone is entered, the portfolio holds SPY while the regime is ON and SHY while it is OFF.
Backtest results follow BTS Methodology.
Caveats
The opportunity set was not constant throughout the report window. Seventeen country ETFs were eligible at inception, with later funds becoming eligible through 2016 as their source histories began.
The published BTS Strength Zones were defined from historical data through 2025. The results are therefore in-sample rather than independent out-of-sample validation.
Implementation remained meaningful at 174.6 modeled executions per year. Equal weighting can also create correlated exposure to related regions, currencies, commodities and global risk factors.
SPY up/down-year figures are filtered-year diagnostics rather than continuous-window backtests.
Read the report
The full Strength Zones Backtest: Country ETFs report provides complete strategy rules and mechanics, detailed performance and risk results, market-capacity analysis, return tables, rolling-window diagnostics and implementation guidance.
About Backtested Strategies
Backtested Strategies (BTS) is a financial research publisher operated by Marquantex LLC, focused on systematic trading strategies, rigorous backtests and market tools for serious investors. BTS publishes backtests under a standardized, institutional-grade methodology that makes strategy rules, assumptions, benchmarks, trading-cost treatment, portfolio accounting and reporting conventions explicit. Its research is designed to help investors judge strategy behavior, risk, implementation demands and portfolio fit with the full structure of each test in view.